Inspect browser test results
In addition to running API performance tests, you can also run browser tests in Grafana Cloud k6. Browser tests allow you to navigate through web pages and measure frontend metrics, helping you find issues that are hard to catch when testing only the backend.
This page describes the sections of the Test Result view that are added or modified to display browser test results. These sections provide more details about your performance results: Browser Timeline, Browser Metrics, and Browser Screenshots.
Web Vital Metrics
When running a browser test, k6 collects the Web Vital metrics. These metrics provide signals related to loading performance, interactivity, and visual stability, which assess the user experience of your website and identify opportunities for improvement.
Performance Overview
For browser tests, the Performance overview section shows you an aggregate of the Web Vital metrics. These scores represent the 75th percentile values for the test run, which can include multiple pages.

Get Cloud Insights
Cloud Insights automatically analyzes your test results to identify performance issues and improvements. For browser tests, it assesses the Web Vitals metrics to evaluate if your website meets the recommended targets.
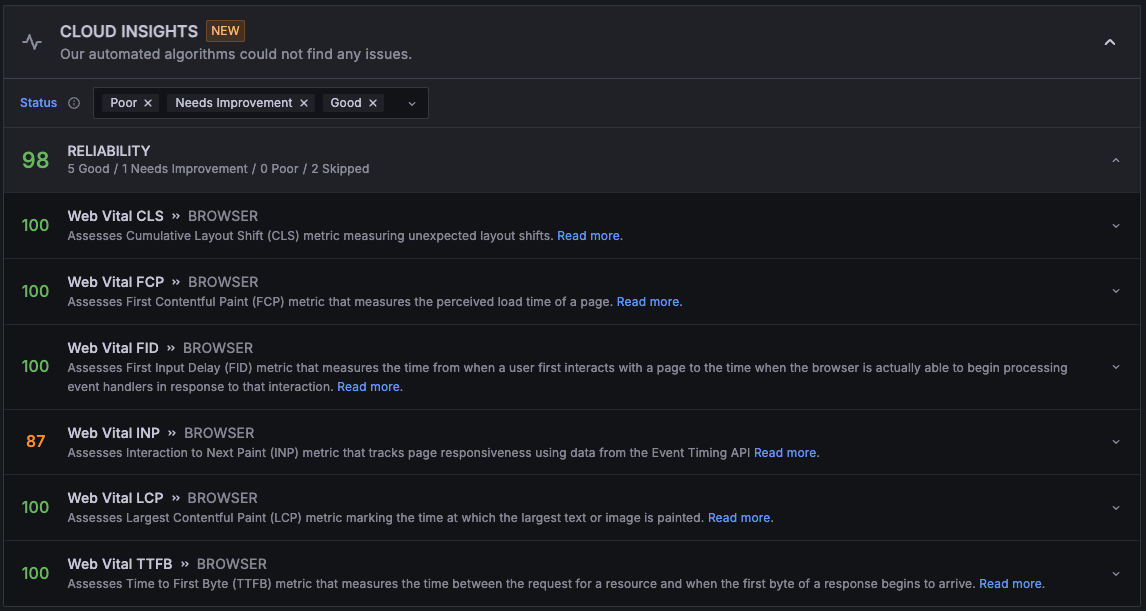
Learn more about the Web Vital audits in the Cloud Insights reference.
Inspect Browser Timeline
The Browser Timeline section shows a separate view, where you can inspect the individual Web Vital metrics for each page in your test run and each method that was invoked for each page.

Each span in the timeline view represents a page, and a new span is created based on your test run script, when a navigation method is called, such as page.goto, or locator.click.
For each span, you can:
- Hover over the timeline bar to view when each method was invoked during the test run
- View the page load time, URL, Web Vital metrics, and list of invoked methods
- View screenshots that were taken using the
page.screenshotmethod. You can click on each screenshot to open a dialog box window where you can download the image.
You can also use the Trace picker to select between different iterations of the test run and the Compact mode toggle to view only the timeline bar for each span.
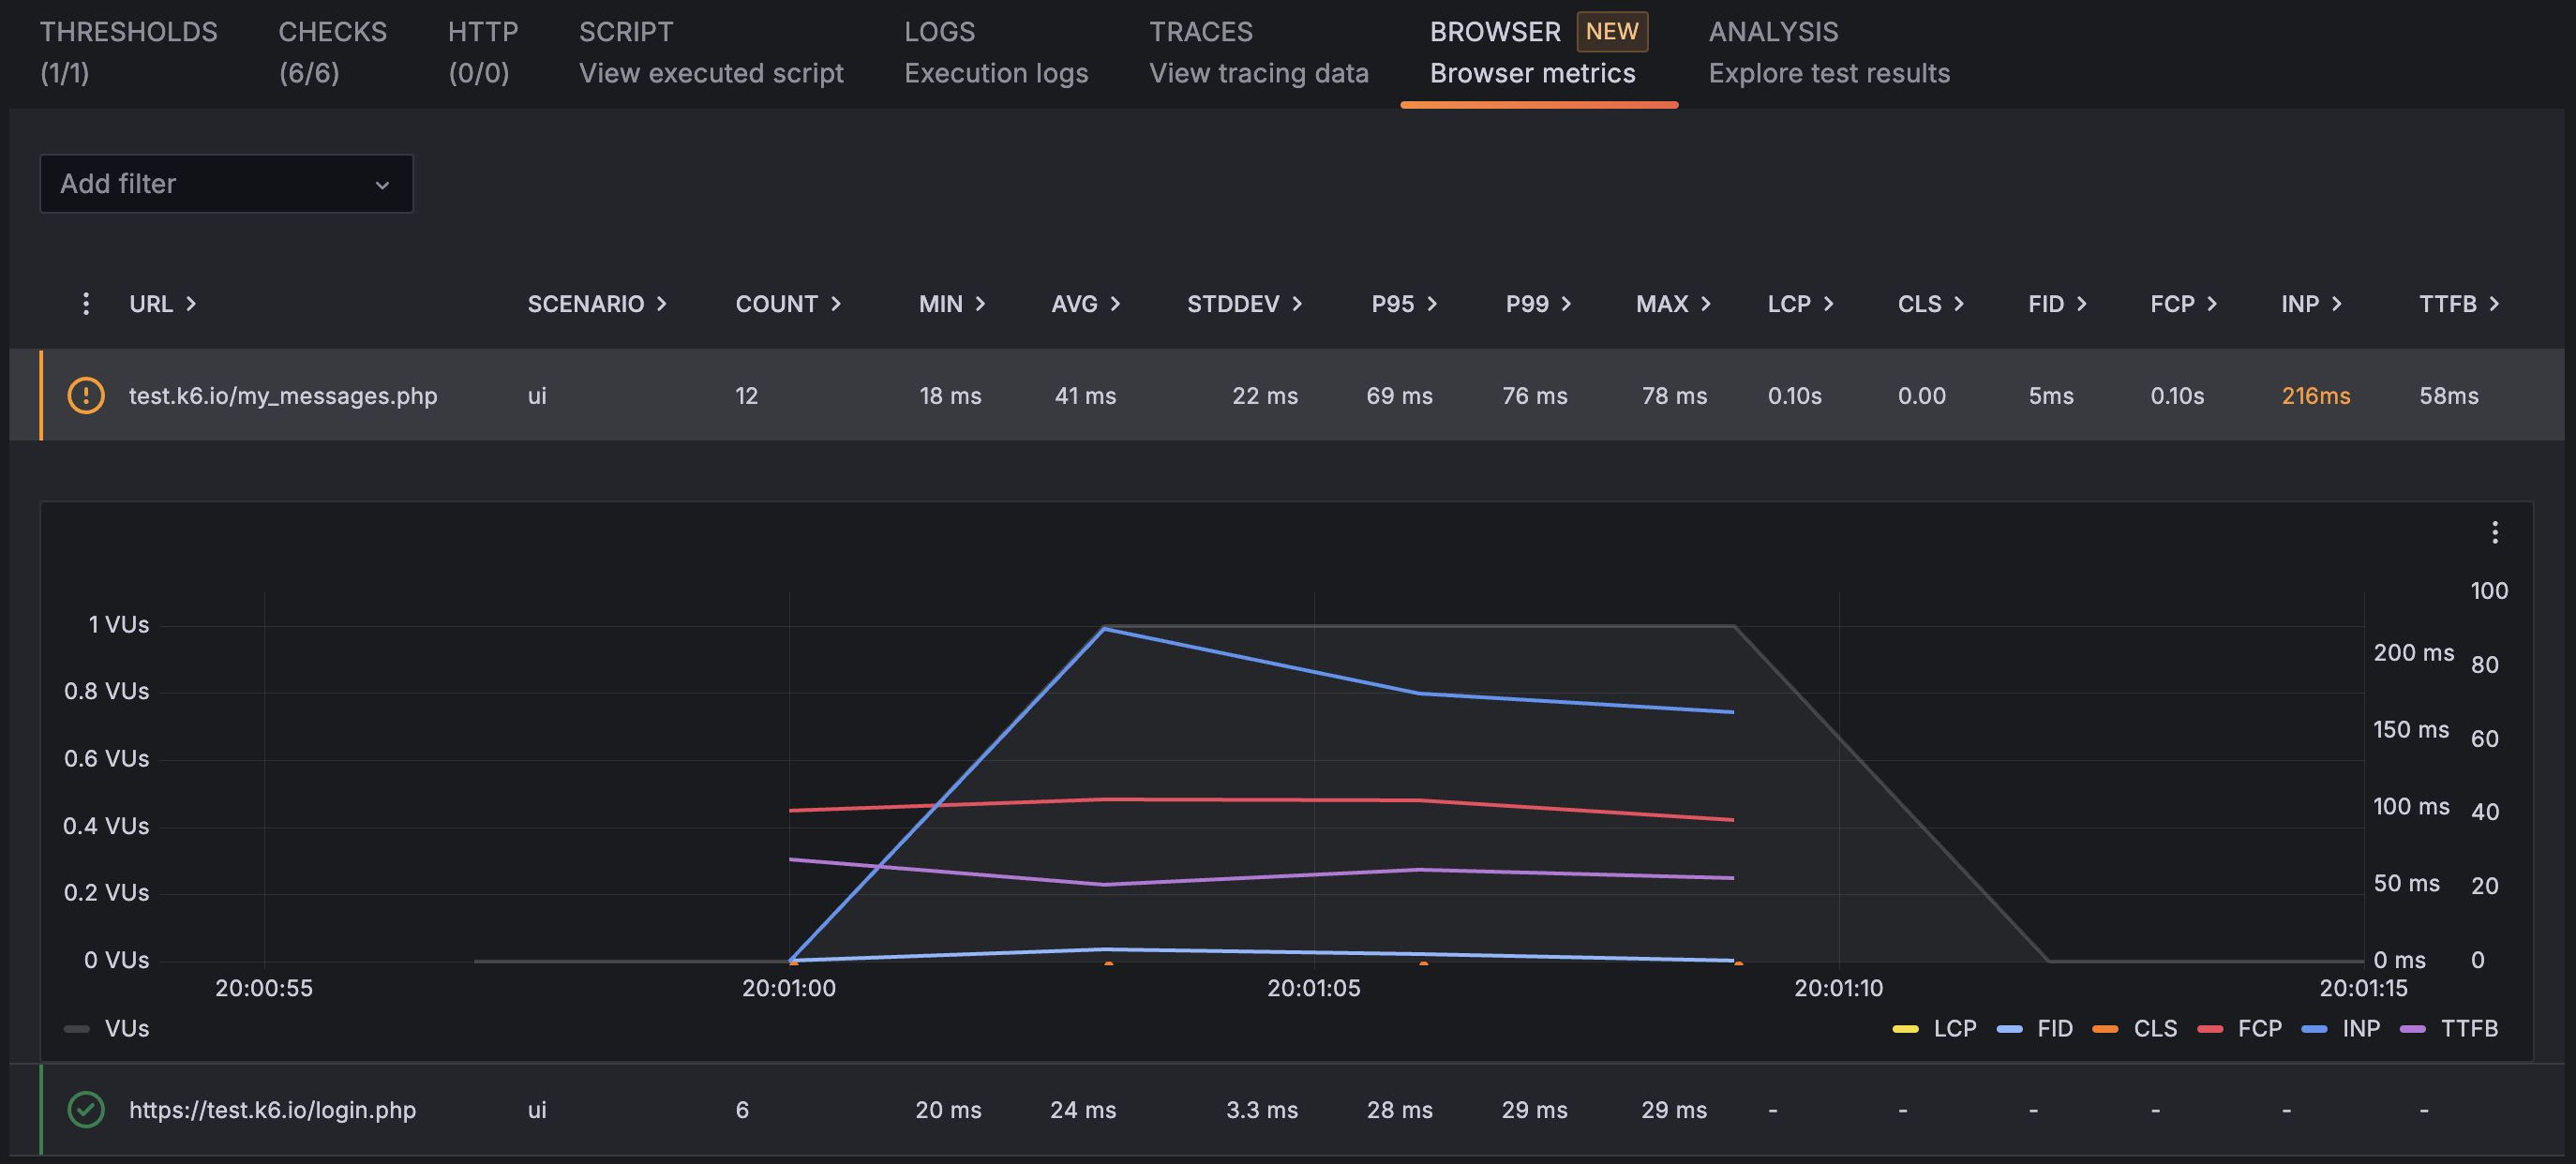
Inspect Browser Metrics
The Browser tab allows you to inspect Web Vital metrics for each page accessed during your browser test. In this view, you can sort pages by Web Vital results and filter them by URLs or k6 Scenarios.
This view highlights if any Web Vital metrics of a particular page Needs improvement (orange color) or has Poor results (red color). To inspect a webpage in detail:
- Select its row.
- In the expanded row, inspect:
- The performance score of the Web Vitals assessment.
- The results of the Web Vital metrics during the test.
- Use Explore to correlate browser metrics with other system metrics.
Inspect Browser Screenshots
The Browser Screenshots section contains a list of all the screenshots that were taken during the test run with the page.screenshot method.

You can click on each screenshot thumbnail to open a dialog box window that shows the expanded image, and click the Download button to download the image file.
Save screenshots for each iteration
When using the page.screenshot method, you have to pass a path parameter that includes the path and name of the file. If your test script includes multiple iterations, and the path value in your test script is static, Grafana Cloud k6 overwrites the screenshots during each iteration, and only saves the ones from the last iteration.
To save a screenshot for each iteration of your test, you can add a variable that changes for each iteration of your test run, such as an execution context variable:
import { browser } from 'k6/browser';
import exec from 'k6/execution';

// ...

export default async function () {
  const context = await browser.newContext();
  const page = await context.newPage();

  try {
    await page.goto('https://quickpizza.grafana.com');
    const path = `browser_${exec.vu.idInTest}-${exec.vu.iterationInScenario}.png`;
    await page.screenshot({ path: path });
  } finally {
    await page.close();
  }
}

