
Investigate traces with Grafana Assistant
Using Grafana Assistant, an AI-powered observability agent in Grafana Cloud, you can use natural language to monitor, troubleshoot, and manage your systems. It helps assess tracing data to find root causes, service problems, and latency issues, eliminating the need for complex query languages or memorizing dashboard locations.
The Assistant understands observability data across metrics, logs, traces, profiles, and databases, simplifying insights and problem-solving without requiring deep technical expertise. Instead of learning complex query languages or memorizing dashboard locations, you can ask questions like “Show CPU usage” or “Create a dashboard for this database.”
Refer to the Introduction to the Grafana Assistant for more information.
Before you begin
To use the Assistant to help investigate your tracing data, you need to:
- Set up the Assistant. Refer to Get started with Grafana Assistant for instructions.
- Have a configured Grafana Cloud Traces or Tempo data source that’s ingesting tracing data. Refer to Set up tracing for instructions.
How to start
Like other AI chat tools, the Assistant uses prompts to help explore data. This document provides three examples to help you explore your tracing data:
- Visualize the span hierarchy for this trace and point out the bottlenecks
- Find the service that is the root cause of any errors.
- Generate a TraceQL query to find services that are generating the highest latency.
Refer to the Prompting guide to learn more about using prompts with the Assistant.
Tip
Use the Assistant tutorial in Grafana Cloud by clicking the three-dot menu in the Assistant chat and selecting Open tutorial. You can also refer to the Start your first conversation in the Assistant Get started documentation.
You can specify any data source that has tracing data, such as Cloud Traces or Tempo, by using @ to mention the data source in the prompt.
To learn more about Grafana Assistant, refer to AI for Grafana onboarding: Get your teams started quicker with Grafana Assistant and the Grafana Assistant documentation.
Run a prompt
When you want to run a prompt, follow these steps:
Open your Grafana instance in Grafana Cloud.
Open Grafana Assistant by selecting the AI icon in the upper right corner.
![Select the Grafana Assistant icon to open the chat window]()
Optional: Enter
@to mention and locate your data source.Paste and run a prompt.
The Assistant reviews your traces to provide some insights. Note that the outputs change depending on the tracing data that you have available.
Refer to Get started with Grafana Assistant for more information about prompts, capabilities, and how you can use the Assistant.
Example 1: Visualize a span hierarchy
Span hierarchies show the relationship between spans and their services. Use a span hierarchy to visualize which services are calling which other services. For example, if a checkout span is experiencing a bottleneck, you can use the span hierarchy to see the relationships and determine what’s causing those errors.
Example prompt: Visualize the span hierarchy for this trace and point out the bottlenecks.
Refer to Correlate multiple signals for more information.
Example 2: Find a service causing errors
Tracing data provides the breadcrumb trail through your services. It’s a useful tool for pinpointing a service’s latency issues. This example prompt illustrates how you can use the Assistant to locate one or more root causes of errors.
Example prompt: Find the service that is the root cause of any errors.
Refer to Run a systemic investigation for more information.
Example 3: Generate a TraceQL query
This example demonstrates how to use Grafana Assistant to generate a TraceQL query. By providing a natural language prompt, the Assistant can help you construct complex queries to identify services with the highest latency.
Tip
Use the Construct a TraceQL query documentation as a resource to provide more context for the Assistant. Use
@along with the document URL,https://grafana.com/docs/tempo/latest/traceql/construct-traceql-queries/, in the prompt.
When you run this prompt, include your tracing data source in the prompt.
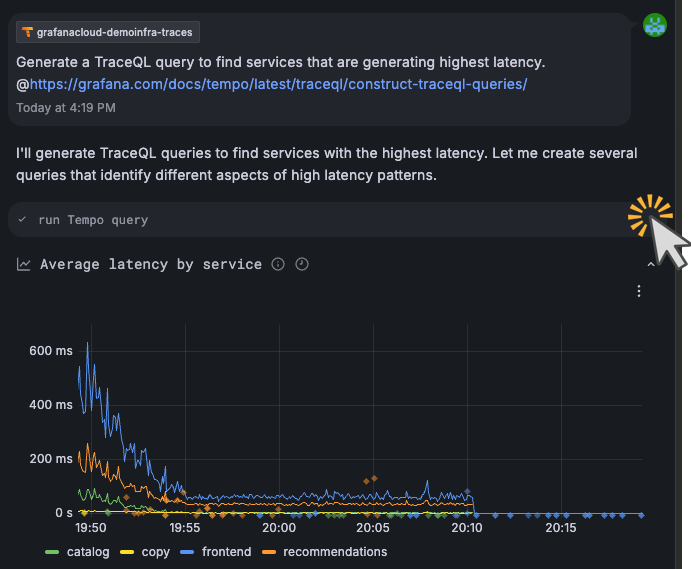
Example prompt:
Generate a TraceQL query to find services that are generating highest latency.
@https://grafana.com/docs/tempo/latest/traceql/construct-traceql-queries/
Refer to TraceQL workflows for more information.
View additional details in Assistant
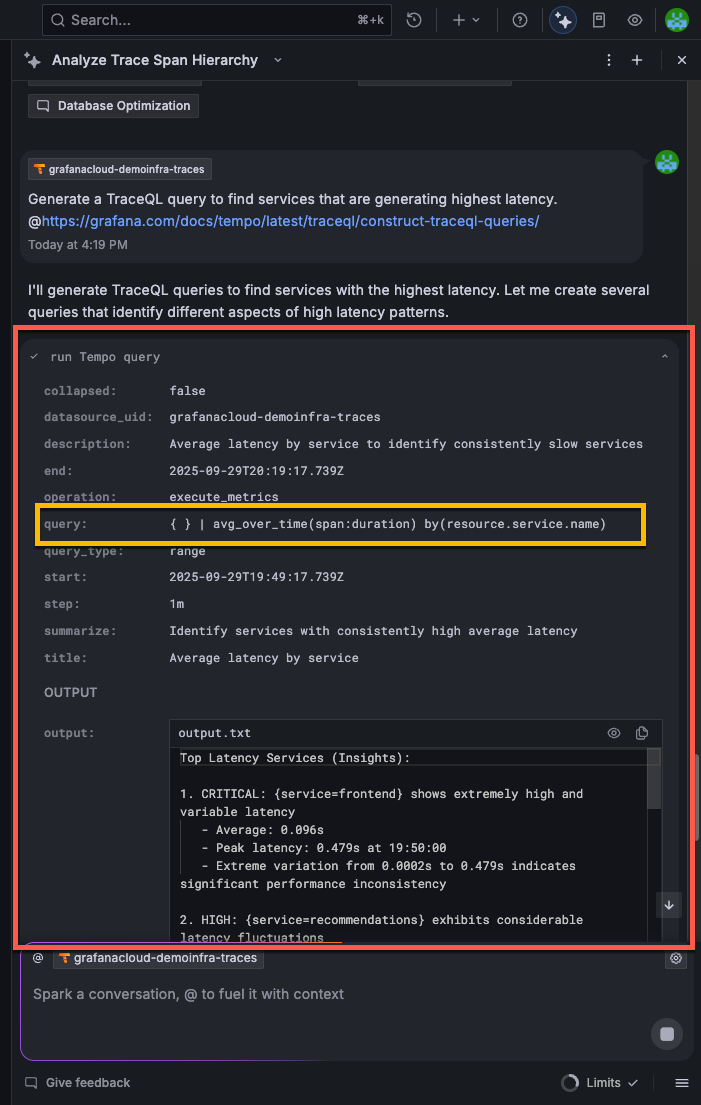
When Assistant runs a tracing query, it collapses the information used in that query. To view the extra details, select the run Tempo query to expand the section.
When you expand the section, you can view all of the data related to the current query, including the TraceQL. You can also run the TraceQL in the Tempo data source query editor.
You can run the TraceQL query in the Tempo data source query editor.
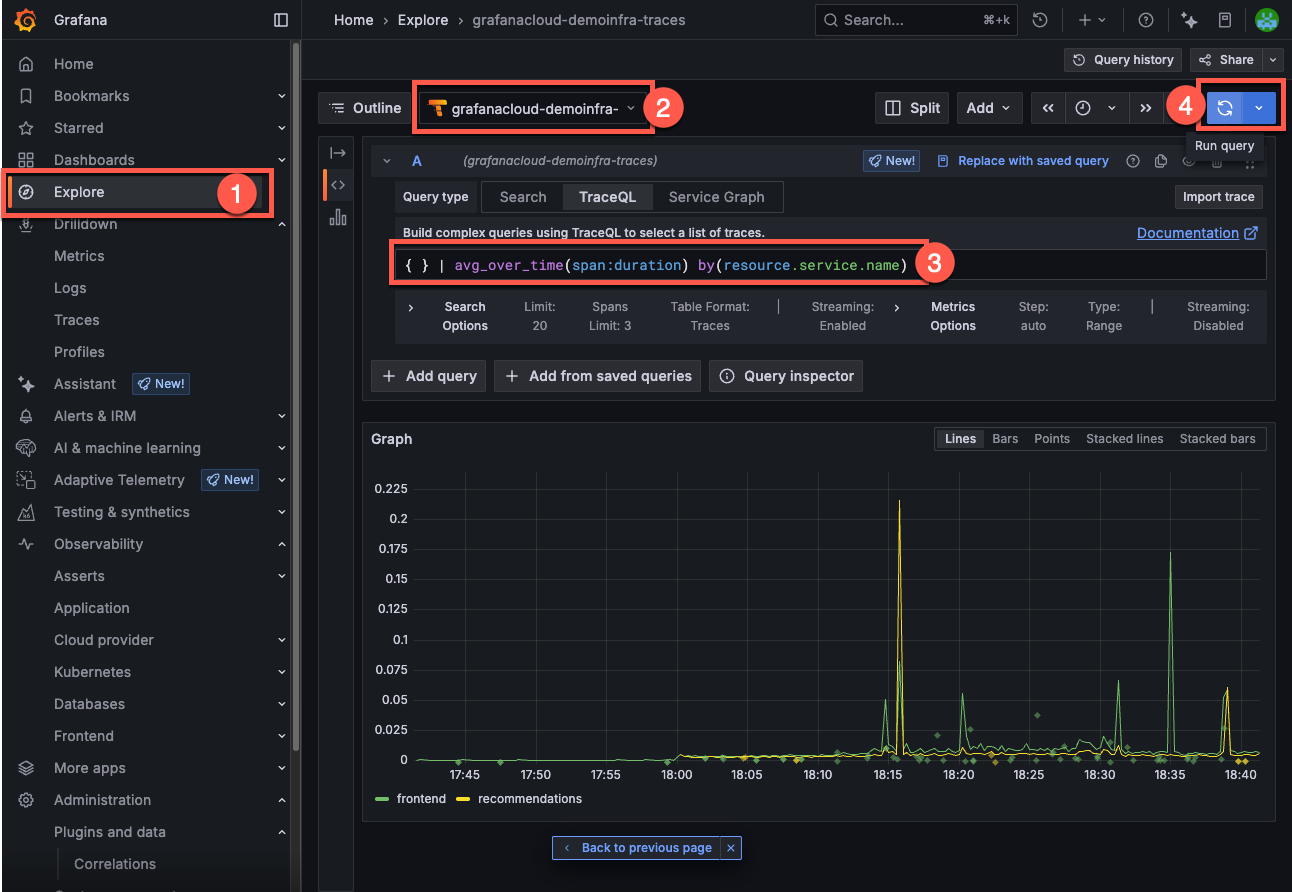
To run the query in the Tempo data source query editor:
- Select the Grafana menu and choose Explore.
- Verify the same tracing data source is selected.
- Copy and paste the TraceQL query into the editor text box in the TraceQL tab.
- Select Run query.
Refer to Write TraceQL queries with the editor for more information about the query editor.


