
Send PostgreSQL logs to Grafana Cloud with Grafana Alloy
This guide shows you how to send logs from a PostgreSQL instance to Grafana Cloud using Grafana Alloy. It also shows you how to search, explore, and view those logs.
Prerequisites
Before you begin, you should have the following available:
- A Grafana Cloud account, as shown in Get started
- A Linux machine
- PostgreSQL installed on your machine
- Grafana Alloy installed on your Linux machine, as shown in the Alloy installation documentation
After you have these installed, you’re ready to begin with this guide.
Configure Alloy to collect and send PostgreSQL logs
Since your Linux machine is already running Alloy, configuring it to send logs is accomplished by modifying the Alloy configuration file.
The Alloy configuration is stored in /etc/alloy/config.alloy by default. Open the file and add the following components to collect PostgreSQL logs and send them to Grafana Cloud.
The Alloy configuration should look like this:
// PostgreSQL metrics collection
prometheus.exporter.postgres "postgresql" {
  data_source_names = ["postgresql://<POSTGRES-USERNAME>:<POSTGRES-PASSWORD>@localhost:5432/database_name?sslmode=disable""]
}

prometheus.scrape "postgresql" {
  targets    = prometheus.exporter.postgres.postgresql.targets
  forward_to = [prometheus.remote_write.grafana_cloud.receiver]
}

prometheus.remote_write "grafana_cloud" {
  endpoint {
    url = "https://<CLOUD_ENDPOINT>/api/prom/push"

    basic_auth {
      username = "<USERNAME>"
      password = "<PASSWORD>"
    }
  }
}

// PostgreSQL logs collection
local.file_match "postgresql_logs" {
  path_targets = [{
    __address__ = "localhost",
    __path__    = "/var/log/postgresql/*log",
    instance    = "postgresql-01",
    job         = "integrations/postgresql",
  }]
}

loki.source.file "postgresql_logs" {
  targets    = local.file_match.postgresql_logs.targets
  forward_to = [loki.write.grafana_cloud.receiver]
}

loki.write "grafana_cloud" {
  endpoint {
    url = "https://<cloud-logs-endpoint>/loki/api/v1/push"

    basic_auth {
      username = "<LOGS-USERNAME>"
      password = "<LOGS-PASSWORD>"
    }
  }
}
Make sure that the job and instance labels match for logs and metrics. This ensures that you can quickly dive from metrics graphs to corresponding logs for more details on what actually happened.
You can find more information on configuring the PostgreSQL integration in our PostgreSQL integration documentation.
Check that logs are being ingested into Grafana Cloud
Logs should soon become available in Grafana Cloud. To test this, use the Explore feature. Click the Explore icon (looks like a compass) in the sidebar.
At the top of the page, use the dropdown menu to select your Loki logs data source.
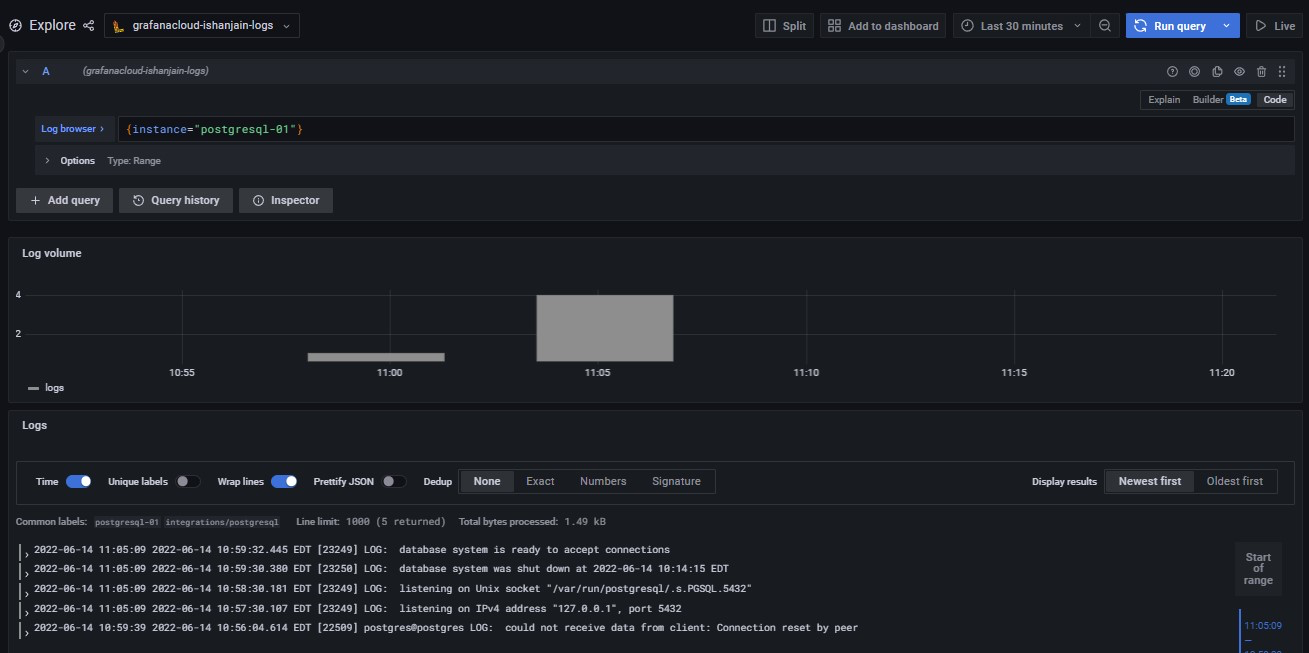
In the Log Browser, Run the query {job="integrations/postgresql"}.
If no log lines appear, logs are not being collected. If you see log lines, this confirms that logs are being received.
If you can’t see logs after several minutes, check your steps for typos and check whether Alloy is running on the Linux machine.
If everything is working correctly, you should see the following:
Conclusion
Complete instructions for creating a dashboard panel (indeed, multiple panels to create a dashboard) are available in the Grafana Add a panel documentation.
You can also use the loki.process component to transform log lines, labels, and timestamps.


