Collect logs with Grafana Alloy
The Grafana Cloud stack includes a logging service powered by Grafana Loki, a Prometheus-inspired log aggregation system. This means that you’re not required to run your own Loki environment, though you can ship logs to Grafana Cloud using another supported client if you want to maintain a self-hosted Loki environment.
Before you begin
To follow the steps in this guide, you need the following:
- A Grafana Cloud account
- An application or system generating logs
Install Grafana Alloy
Grafana Alloy supports collecting logs and sending them to Loki using its loki component. Grafana Alloy is usually deployed to every machine that has log data to be monitored.
To get started with Grafana Alloy and send logs to Loki, you need to install and configure Alloy. You can follow the Alloy documentation to install Alloy on your preferred platform.
Installing Alloy
To get started with Grafana Alloy and send logs to Loki, you need to install and configure Alloy. You can follow the Alloy documentation to install Alloy on your preferred platform.
If you are migrating to Grafana Alloy, refer to one of the following migration topics:
- Migrate from Grafana Agent Static
- Migrate from Grafana Agent Flow
- Migrate from Grafana Agent Operator
- Migrate from OpenTelemetry Collector
- Migrate from Prometheus
- Migrate from Promtail
Components of Alloy for logs
Alloy pipelines are built using components that perform specific functions. For logs these can be broken down into three categories:
- Collector: These components collect/receive logs from various sources. This can be scraping logs from a file, receiving logs over HTTP, gRPC or ingesting logs from a message queue.
- Transformer: These components can be used to manipulate logs before they are sent to a writer. This can be used to add additional metadata, filter logs, or batch logs before sending them to a writer.
- Writer: These components send logs to the desired destination. Our documentation will focus on sending logs to Loki, but Alloy supports sending logs to various destinations.
Log components in Alloy
Here is a non-exhaustive list of components that can be used to build a log pipeline in Alloy. For a complete list of components, refer to the components list.
| Type | Component |
|---|---|
| Collector | loki.source.api |
| Collector | loki.source.awsfirehose |
| Collector | loki.source.azure_event_hubs |
| Collector | loki.source.cloudflare |
| Collector | loki.source.docker |
| Collector | loki.source.file |
| Collector | loki.source.gcplog |
| Collector | loki.source.gelf |
| Collector | loki.source.heroku |
| Collector | loki.source.journal |
| Collector | loki.source.kafka |
| Collector | loki.source.kubernetes |
| Collector | loki.source.kubernetes_events |
| Collector | loki.source.podlogs |
| Collector | loki.source.syslog |
| Collector | loki.source.windowsevent |
| Collector | otelcol.receiver.loki |
| Transformer | loki.relabel |
| Transformer | loki.process |
| Writer | loki.write |
| Writer | otelcol.exporter.loki |
| Writer | otelcol.exporter.logging |
Review the Grafana Alloy configuration file
If you are using query acceleration with Bloom filters, you must enable structured_metadata in your Alloy configuration.
Here is a sample config.alloy file with structured_metadata enabled.
loki.source.api "loki_push_api" {
http {
listen_address = "0.0.0.0"
listen_port = 9999
}
forward_to = [
loki.process.labels.receiver,
]
}
loki.process "labels" {
stage.json {
expressions = { "extracted_service" = "service_name",
"extracted_code_line" = "code_line",
"extracted_server" = "server_id",
}
}
stage.labels {
values = {
"service_name" = "extracted_service",
}
}
stage.structured_metadata {
values = {
"code_line" = "extracted_code_line",
"server" = "extracted_server",
}
}
forward_to = [loki.write.local.receiver]
}
loki.write "local" {
endpoint {
url = "http://loki:3100/loki/api/v1/push"
}
}
Alloy interactive tutorials for logs
To learn more about how to configure Alloy to send logs to Loki within different scenarios, follow these interactive tutorials:
Confirm logs are being ingested into Grafana Cloud
Within several minutes, logs should begin to be available in Grafana Cloud. To test this, use the Explore feature.
To confirm that logs are being sent to Grafana Cloud:
Click Explore in the left sidebar menu to start.
This takes you to the Explore page.
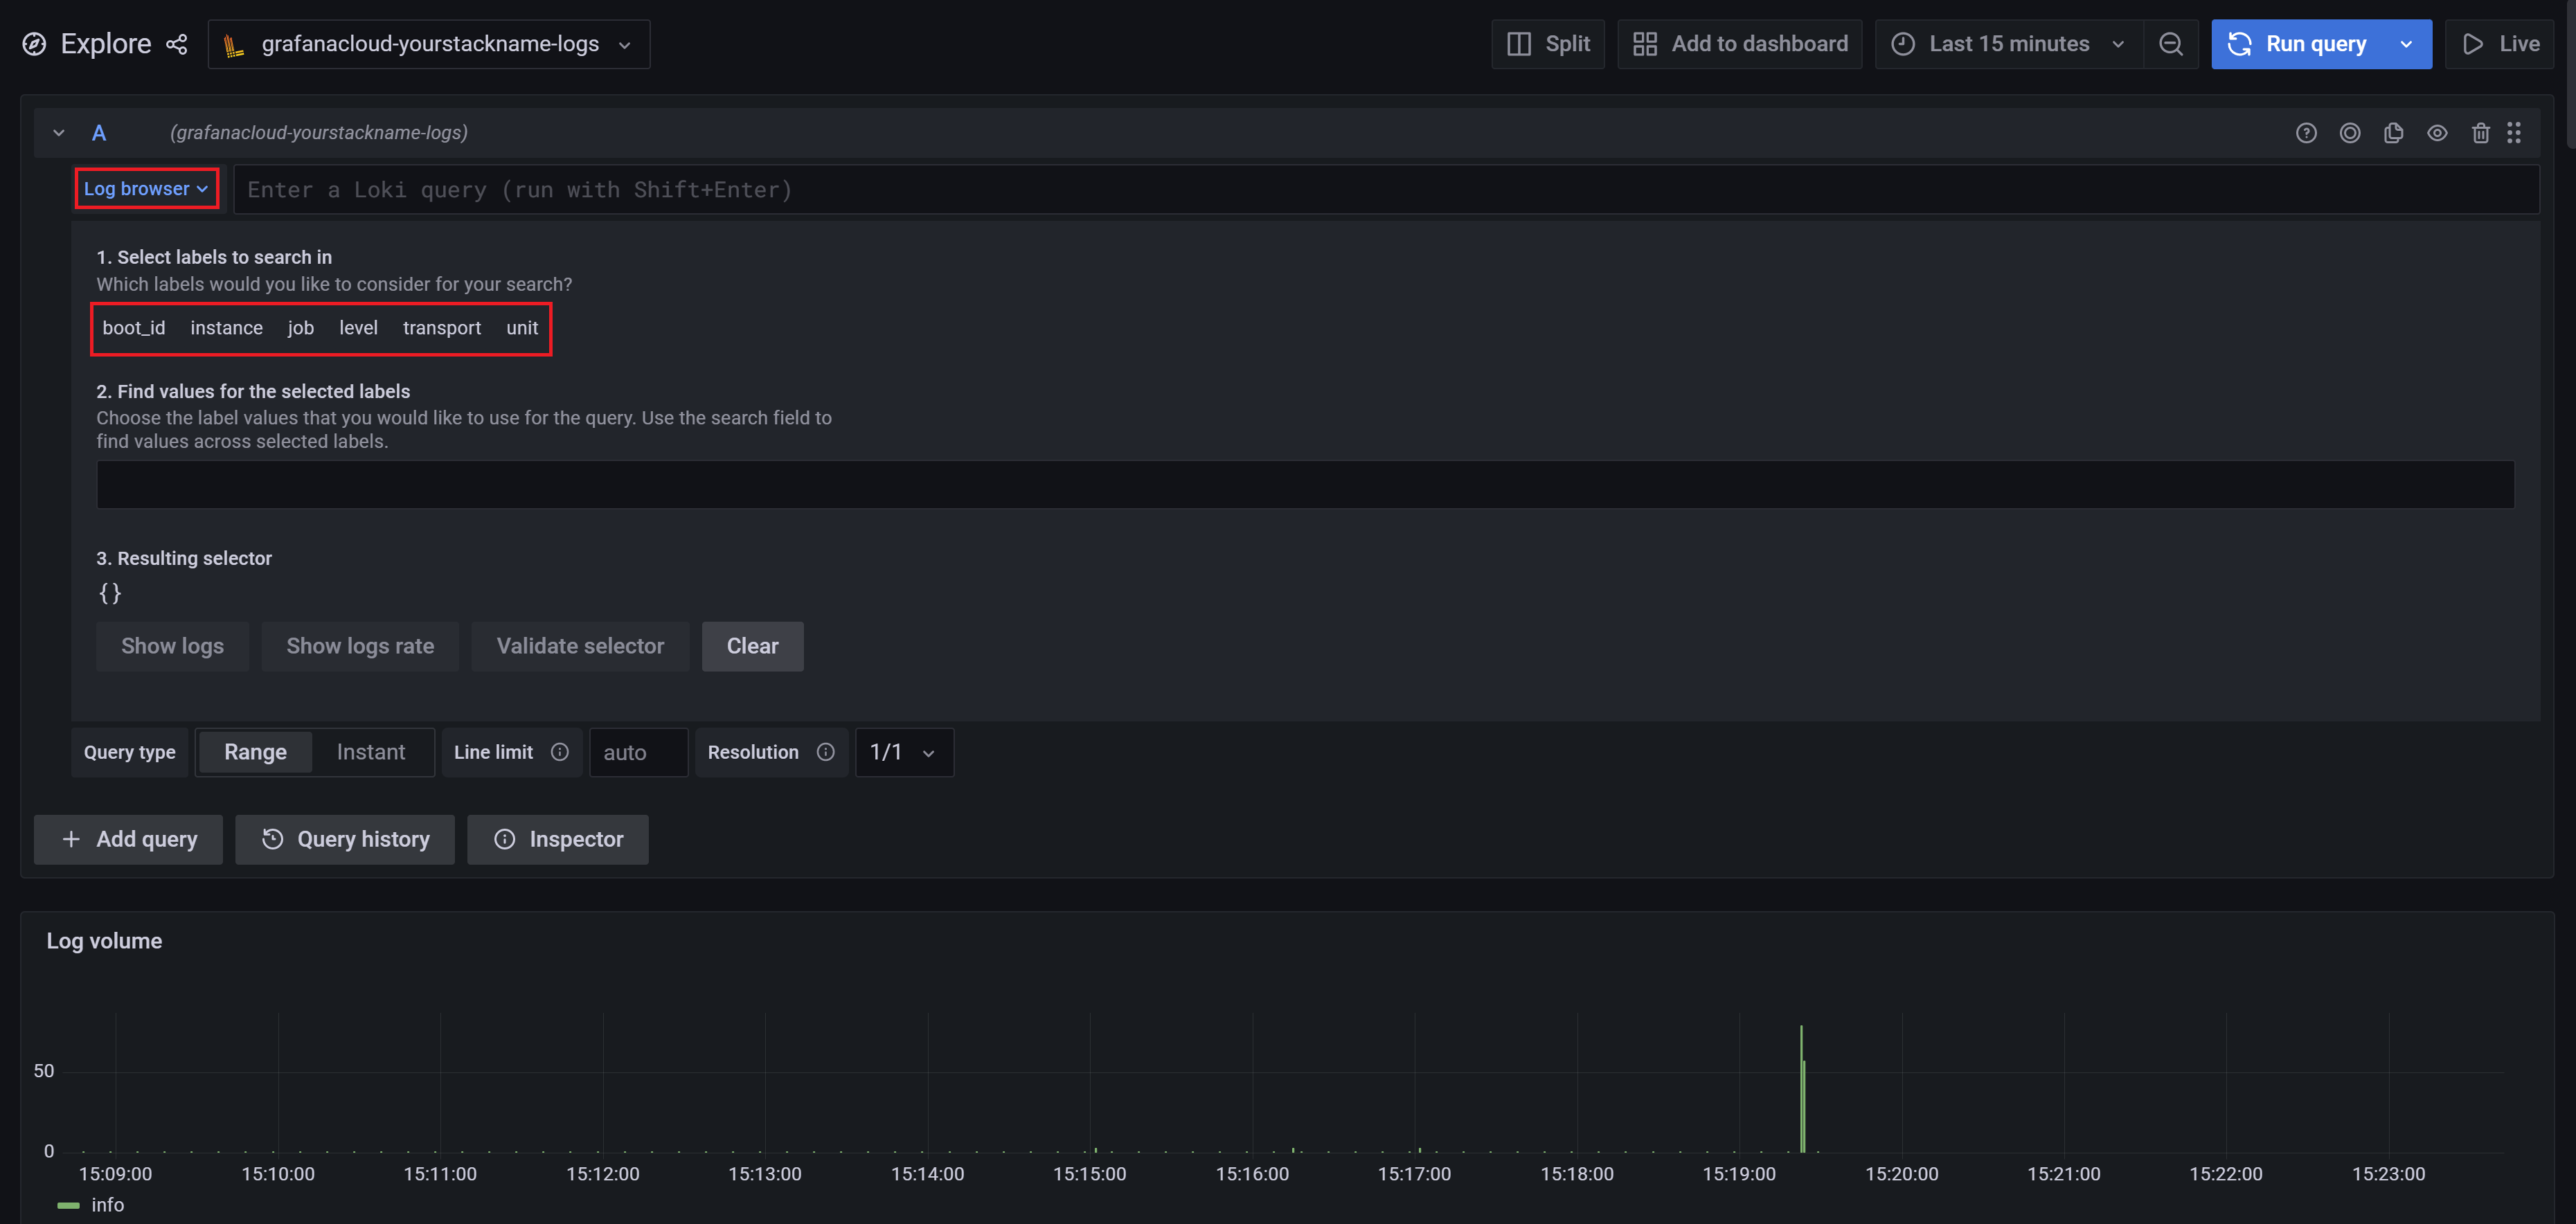
At the top of the page, use the dropdown menu to select your Loki logs data source. This should be named
grafanacloud-$yourstackname-logs.The following image shows the Log browser dropdown used to find the labels for logs being ingested to your Grafana Cloud environment.
![Explore_Log_Browser_labels]()
If no log labels appear, logs are not being collected. If labels are listed, this confirms that logs are being received.
If logs are not displayed after several minutes, ensure Alloy is running and check your steps for typos.
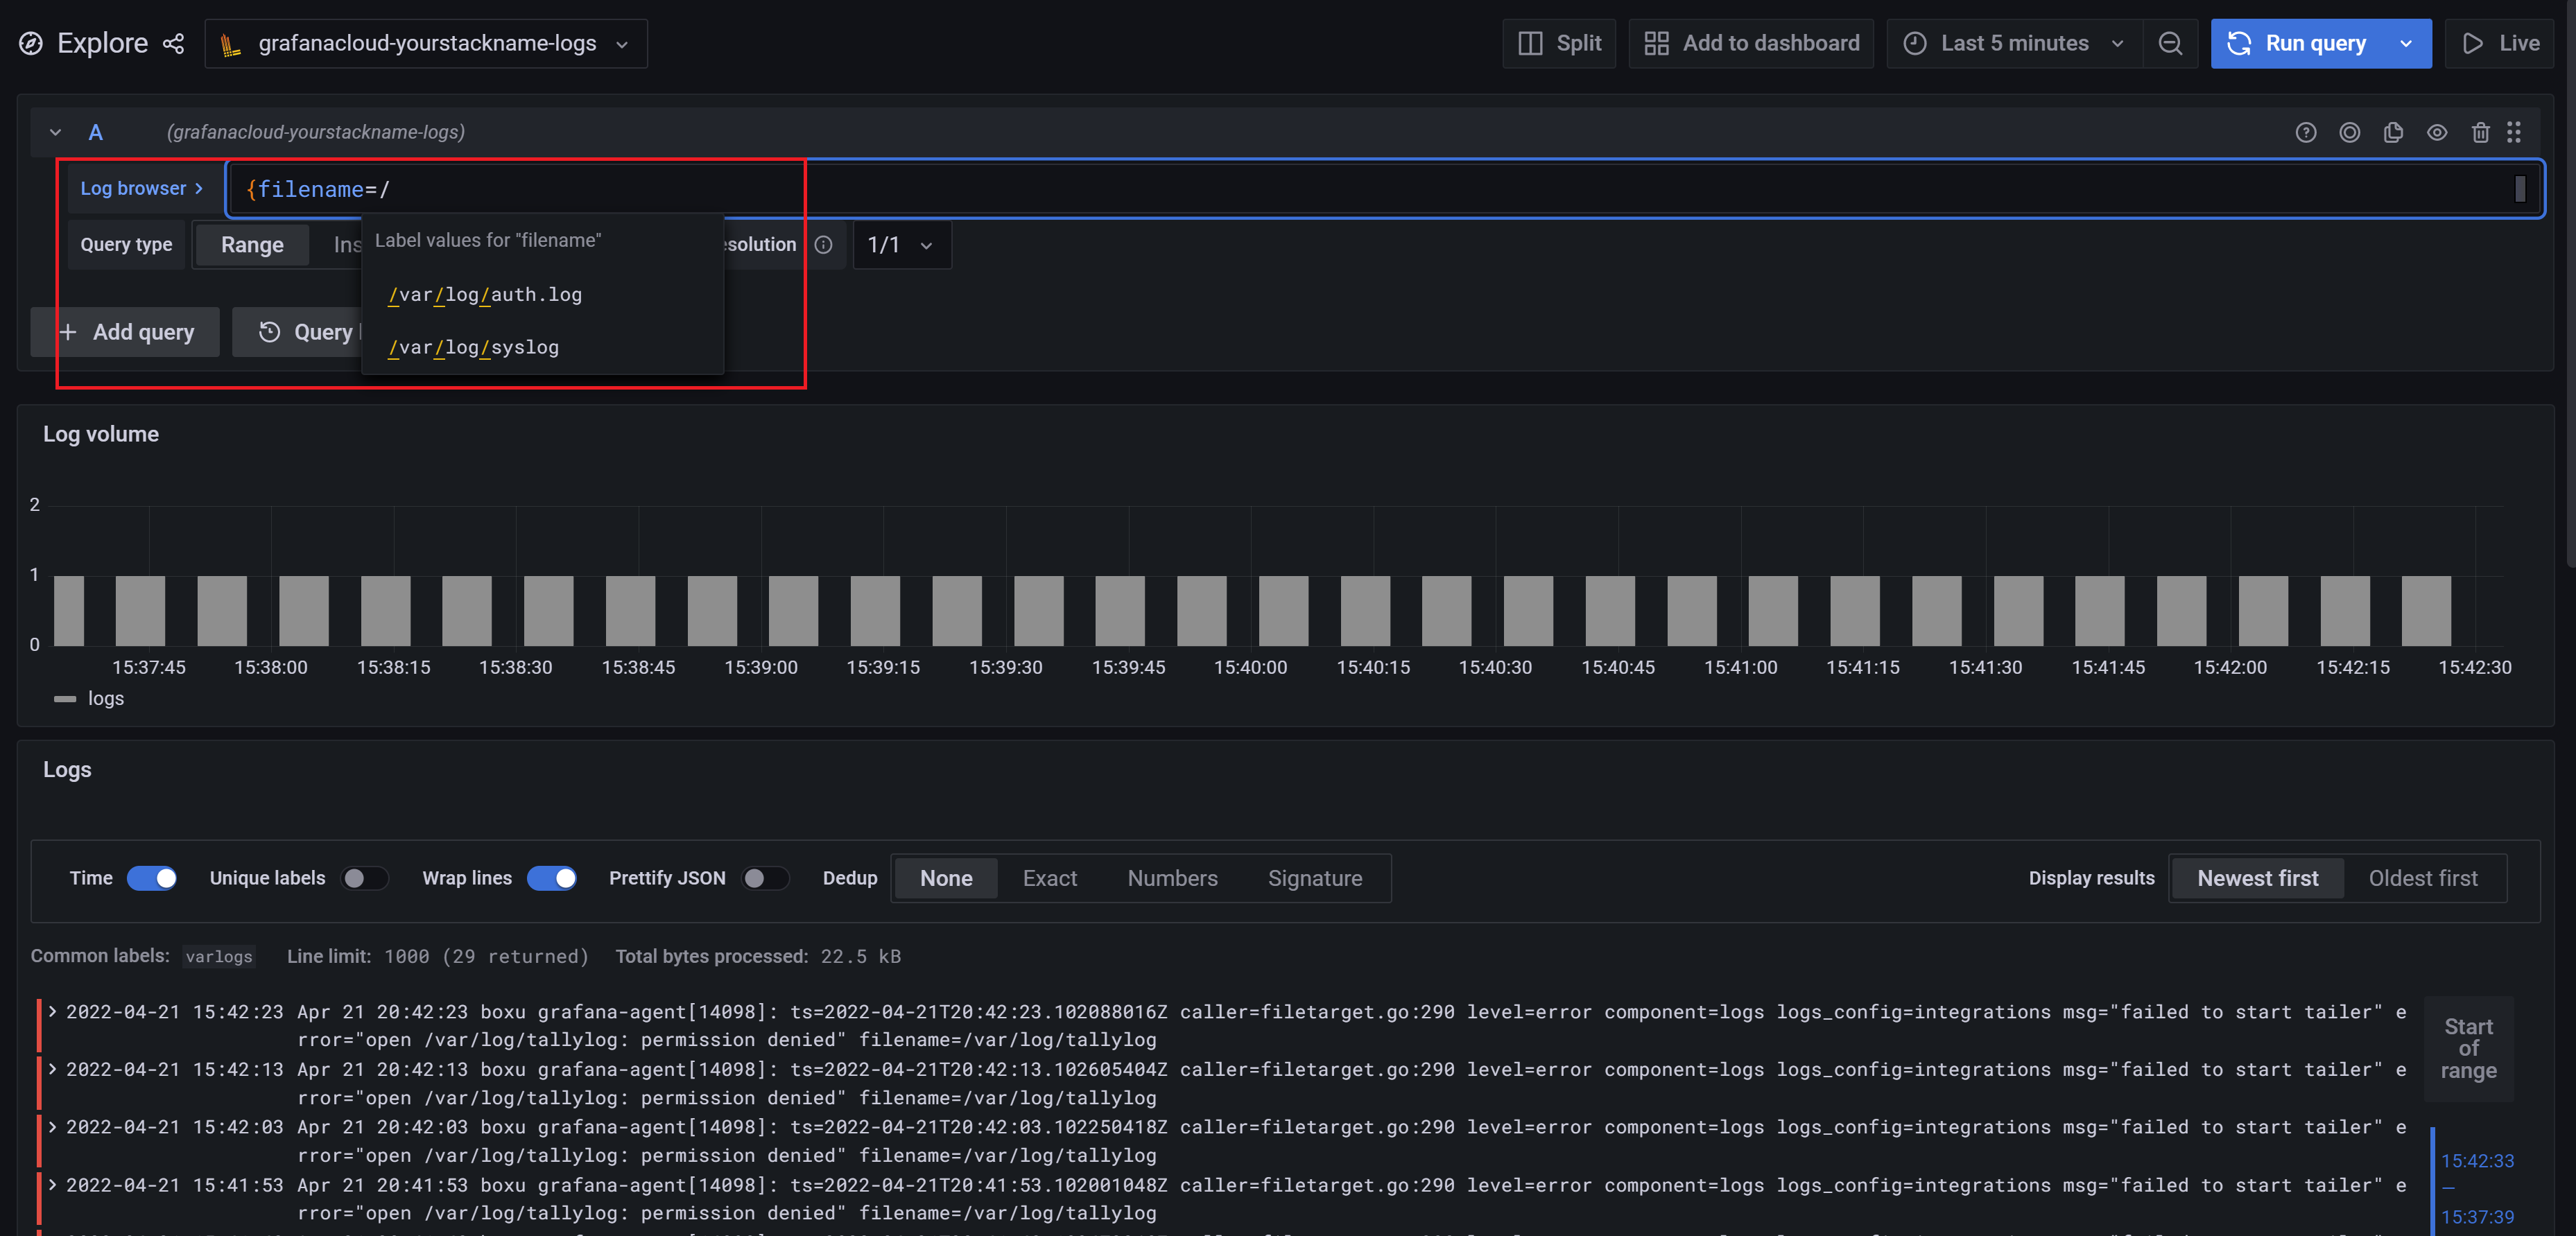
In addition to the Log browser dropdown, the Explore user interface also supports autocomplete options:

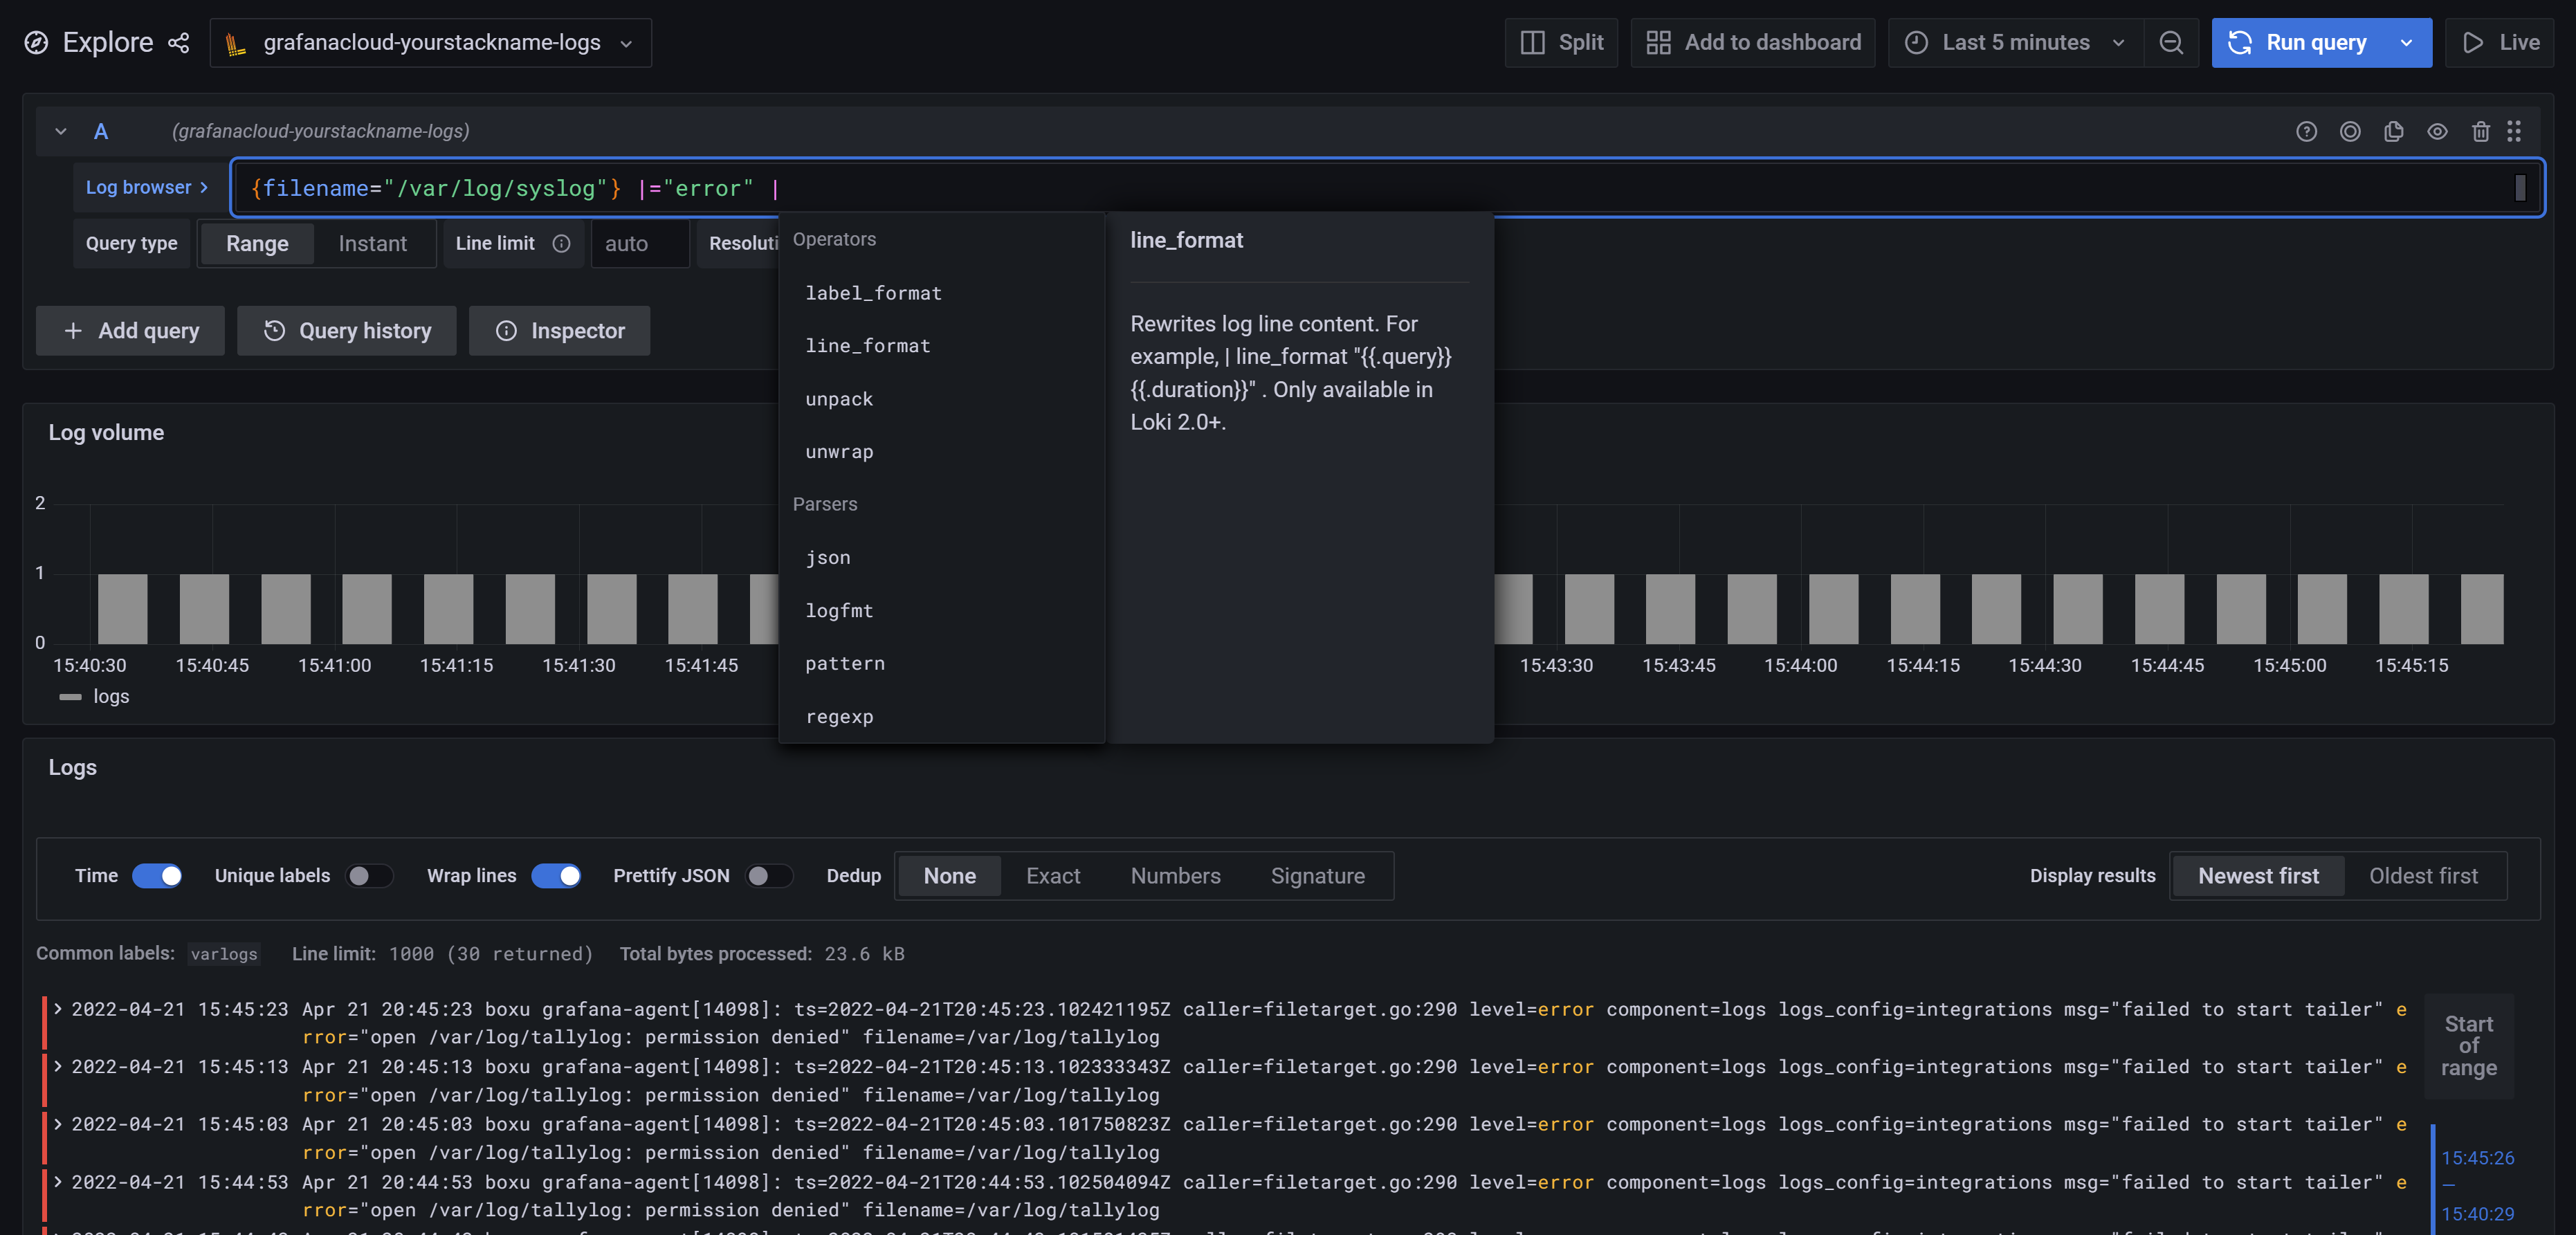
Below is another example of other operators and parsers available. For more details about querying log data, see LogQL: Log query language.

Query logs and create panels
Once you have Grafana Alloy up and running on your log source, give it some time to start collecting logs. Eventually, you will be able to query logs and create panels inside dashboards using Loki as a datasource.
Querying logs is done using LogQL which can be used in both Explore and when creating dashboard panels.
For examples and feature showcases, check out play.grafana.org for ideas and inspiration.
Was this page helpful?
Related resources from Grafana Labs


