
Self-managed setups and Fleet Management
Grafana Fleet Management is a Grafana Cloud feature, but you can use it with self-managed enterprise or on-premises setups where a connection to Grafana Cloud is possible.
Create a free Grafana Cloud account
Sign up for a free Grafana Cloud account and set up your stack. With the free plan, you can collect internal telemetry to monitor your collectors and add configuration pipelines to remotely configure them.
Register your collectors
Once your stack is ready, you need to onboard your collectors to Fleet Management.
Fleet Management must be used with Alloy collectors and is recommended for use with Alloy v1.7.2 or later.
If you’re using an earlier version, make sure to include the --stability.level=public-preview flag when running Alloy.
The Fleet Management service automatically creates self-monitoring pipelines the first time you access the Fleet Management interface.
Refer to Self-monitoring pipelines for more information.
Configure your collectors
Remote configuration is a key feature of Fleet Management, but the content of configuration pipelines isn’t prescribed. You can export your data wherever you choose, even if it’s outside Grafana Cloud.
Self-monitoring pipelines
The Fleet Management interface offers a centralized location to monitor the health of your entire collector fleet. Click on any registered collector in the Inventory tab to see health dashboards and logs. The telemetry that powers this feature comes from self-monitoring configuration pipelines that collect internal metrics and logs. These pipelines are automatically created and activated the first time you access the Fleet Management interface. If you don’t want to monitor your collectors, you can disable the pipelines in the Remote configuration tab in the Fleet Management interface.
Integrations
Fleet Management supports many Grafana Cloud integrations. You can use these integrations to configure your collectors, but you’ll need to modify the pipeline to export the telemetry to an internal, on-premises data sink instead of Grafana Cloud.
Custom pipelines
You can create custom pipelines to remotely configure your collectors, but as with integrations, make sure the export component points to your on-premises backend.
Secure connections
Fleet Management doesn’t currently have a native solution for air-gapped environments, but you can establish secure connections to the Fleet Management service even from restricted networks.
Cloud provider private connectivity
Fleet Management supports private connectivity to the three major cloud providers so you can avoid using the public internet:
Custom proxy setup
You can configure a proxy using Alloy remotecfg proxy arguments.
You can also configure Fleet Management to point to an internal reverse proxy. This approach is useful when you have collectors in restricted networks that cannot access the internet directly, but can reach a central proxy server that does have internet access.
Example: Connect Alloy collectors to Fleet Management with Nginx proxy
In this example of a reverse proxy, Alloy collectors use a central Nginx proxy to communicate securely with Fleet Management.
Architecture
The following diagram shows the proxy setup described in this example:
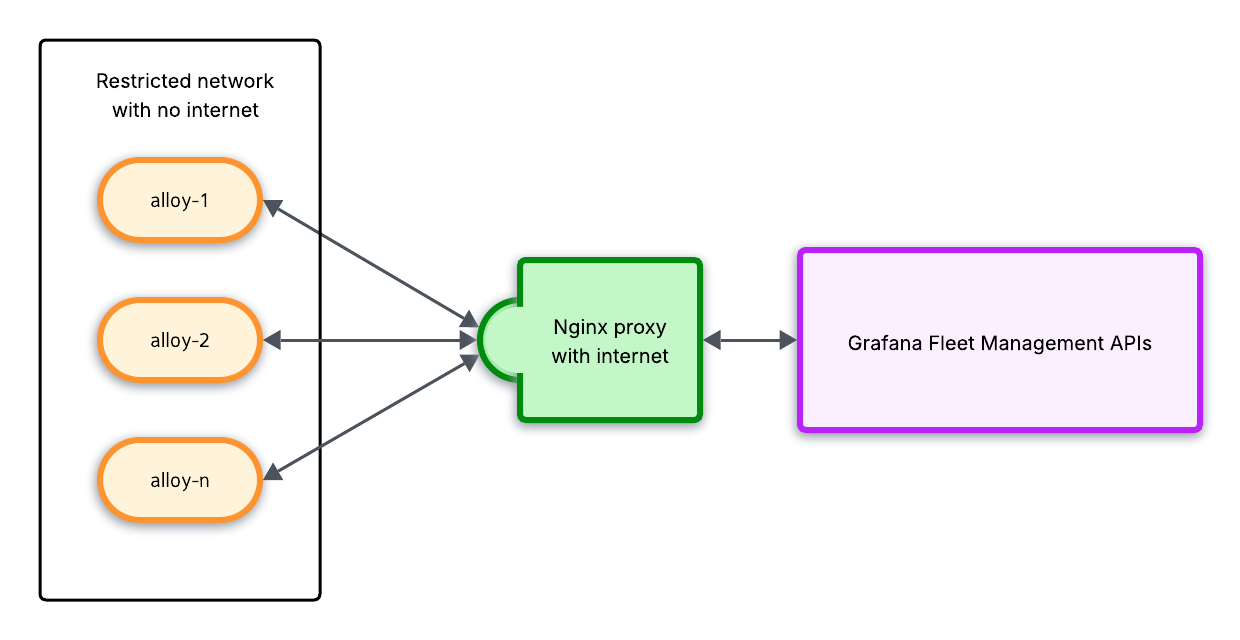
In this setup:
- Collectors running in restricted network environments, such as VMs, containers, or edge devices, have no direct internet access. They send data to a central proxy.
- A central proxy runs on a server with internet access and forwards Fleet Management API requests.
- Telemetry from collectors (metrics, logs, traces, or profiles) can follow the same path or you can configure pipeline export components to send telemetry to an internal data sink.
Configure the proxy
Configure your Nginx proxy to forward Fleet Management API requests using the following configuration. You can adapt this configuration to other proxy solutions such as HAProxy, Envoy, or cloud native load balancers.
server {
    listen 8080;

    location / {
        # Forward requests to your Fleet Management endpoint
        # Replace with your instance's FM endpoint
        proxy_pass https://fleet-management-prod-011.grafana.net;

        # Forward the Authorization header from collectors
        proxy_set_header Authorization $http_authorization;

        # Forward other essential headers
        proxy_set_header X-Real-IP $remote_addr;
        proxy_set_header X-Forwarded-For $proxy_add_x_forwarded_for;

        # TLS/SNI uses upstream host name
        proxy_ssl_server_name on;

        # Buffer configuration for handling API payloads
        proxy_buffer_size 128k;
        proxy_buffers 4 256k;
        proxy_busy_buffers_size 256k;
    }
}
Make sure to replace fleet-management-prod-011.grafana.net with your actual Fleet Management endpoint.
You can find the URL in the Grafana Cloud Fleet Management interface.
In your Grafana Cloud stack, click Connections > Collector > Fleet Management in the left-side menu and switch to the API tab.
Find the remotecfg URL in the Base URL section.
It looks like the following URL, where <CLUSTER_NAME> is the production cluster of your stack:
https://fleet-management-<CLUSTER_NAME>.grafana.net/Configure Alloy
Configure your collectors on restricted networks to use the proxy by updating the remotecfg blocks in their local configuration files:
remotecfg {
    // Point to your internal proxy instead of the public FM endpoint
    url = "http://proxy.internal.example.com:8080"

    basic_auth {
        username = "<your-stack-id>"
        password = "<your-fleet-management-token>"
    }

    id         = constants.hostname
    attributes = {"region" = "us-east", "environment" = "production"}
    poll_frequency = "1m"
}
Replace the following values to match your setup:
url: Your internal proxy address and portusername: Your Grafana Cloud instance ID, which you can find on the API tab in Fleet Managementpassword: Your Fleet Management tokenattributes: Labels for targeting this collector with configuration pipelines
Verify the connection
To verify your proxy setup is working:
- In the Fleet Management UI, verify the collector appears in the Inventory tab with the correct attributes. Refer to the troubleshooting guidance if you don’t see the collector in inventory.
- Monitor the proxy logs to confirm requests are being forwarded to Fleet Management.
If your connection to Fleet Management still isn’t working, confirm that your proxy configuration is correct:
- Check you have used the correct Fleet Management and internal proxy endpoints.
- Confirm you used the correct credentials.
- Look for network blocks such as firewall issues, egress filtering, DNS misconfiguration, etc.
Proxy deployment considerations
Consider the following factors when configuring your proxy setup:
- Network policies: Ensure network-restricted collectors can reach the proxy on the configured port and the proxy can reach
grafana.netendpoints on port 443. - TLS termination: In the example, collectors connect to the proxy over HTTP and the proxy connects to Fleet Management over HTTPS. For additional security, you can configure TLS between collectors and the proxy.
- Authentication: The proxy forwards the Authorization header, so credentials are still validated by Fleet Management.
- High availability: For production deployments, consider running multiple proxy instances behind a load balancer.
- Firewall rules: Restrict the proxy to only allow outbound connections to Fleet Management API endpoints.


