
GCP Private Service Connect and Fleet Management
Send data from your Google Cloud Platform (GCP) private network to Grafana Fleet Management using Private Service Connect (PSC).
Sending your data using GCP PSC can:
- Reduce your GCP egress costs.
- Improve security by keeping your data within the GCP network.
To use this feature, configure a PSC endpoint in your GCP project.
Before you begin
In order to use GCP PSC with Fleet Management, you must have:
- A Grafana Cloud stack hosted on GCP. Check where your stack is hosted by navigating to it in the My Account section of your Grafana Cloud portal and clicking on Details for any service, such as Prometheus or Loki. If the region matches one of the GCP regions where Grafana Cloud is hosted, then your stack is hosted on GCP.
- A GCP network, where you create a PSC endpoint to forward your telemetry.
- A GCP Service Directory namespace to allow PSC to automatically configure the private DNS zone and records for your PSC endpoints.
Other regions
Grafana Cloud’s GCP PSC integration supports native cross-region connectivity, so you can connect to services hosted in other GCP Regions over PSC endpoints.
To set up cross-region connectivity, enable Global Access during PSC endpoint creation.
Set up a PSC endpoint
You can create a PSC endpoint in the GCP console or provision one using your preferred tool, such as Terraform.
Note
To send your telemetry over a private connection, you need to set up PSC endpoints for all Grafana Cloud services where you send data, not just Fleet Management. Repeat these steps to create an endpoint for each service you plan to use, and make note of the endpoint names so you can update pipeline destination URLs.
Use the GCP console
To configure your endpoint from your GCP console, follow these steps.
Open your GCP console and navigate to Private Service Connect.
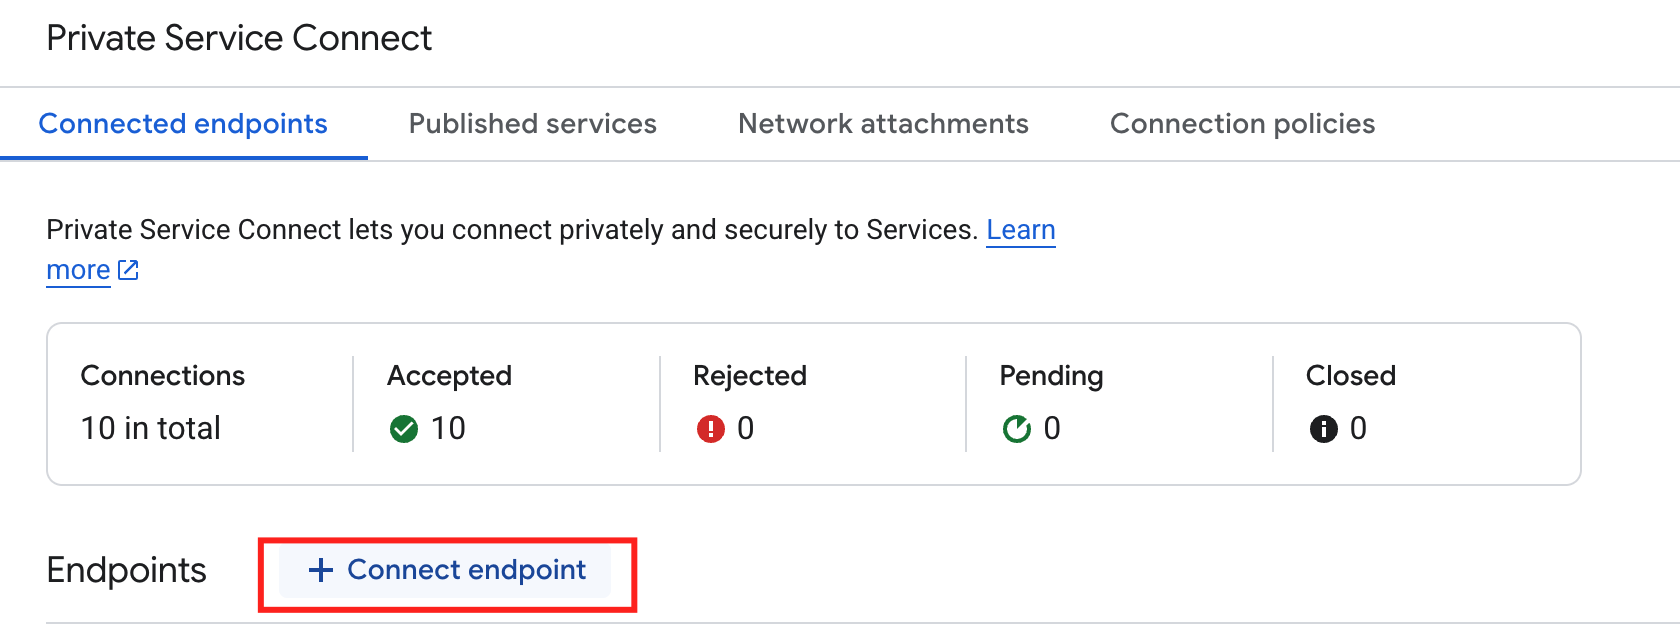
Click the Connected endpoints tab.
Click Connect endpoint.
![Connect endpoints]()
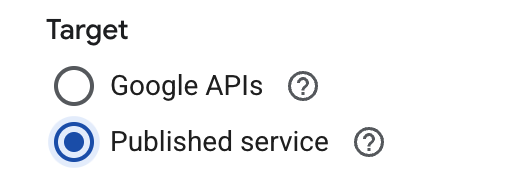
For Target, select Published service.
![Select target type]()
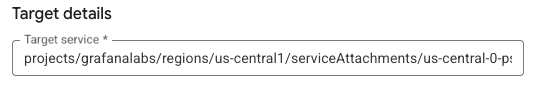
For Target service, enter the service attachment URI from your Fleet Management instance. The service attachment URI is in this format:
projects/SERVICE_PROJECT/regions/REGION/serviceAttachments/SERVICE_NAME.- To find the service attachment URI, navigate to the Fleet Management application in Grafana Cloud: Connections > Collector > Fleet Management.
- Switch to the API tab and scroll to the GCP Private Service Connect section.
- Copy the URI in the Service Attachment box.
- Enter the copied URI into the Target service field in the GCP console.
![Enter Service Attachment URI]()
Note
You can find the Service Attachment URI for other Grafana Cloud services in your Grafana Cloud portal:
- In your portal, click Details for the stack you want to privately connect.
- Click Details on the card for a service, for example, Prometheus.
- Scroll down until you see instructions for sending data with GCP Private Service Connect.
- Locate and copy the Service Attachment URI.
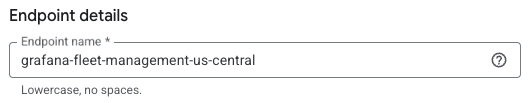
For Endpoint name, enter a name to use for the endpoint, for example
grafana-fleet-management-us-central. This name is also used in the DNS record.![Enter Endpoint name]()
Select a Network and Subnetwork for the endpoint.
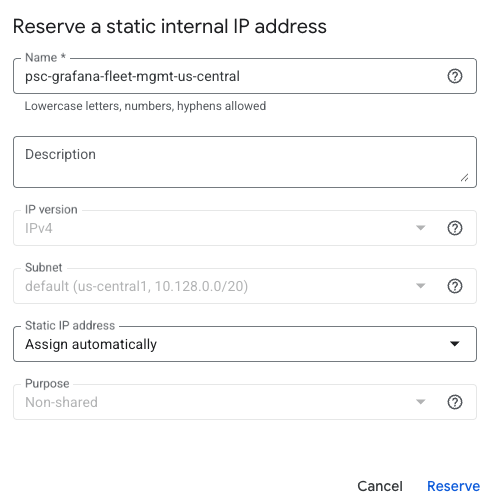
Select an IP address for the endpoint. If you need a new IP address, you can create one:
- Click the IP address drop-down menu and select Create IP address.
- Enter a Name and optional Description for the IP address.
For example, you can name it
psc-grafana-fleet-mgmt-us-central - Select Assign automatically or Let me choose. If you selected Let me choose, enter the custom IP address you want to use.
- Click Reserve.
![Create IP Address]()
To make the endpoint available from any region, select Enable global access. If you do not plan to use cross-region connectivity, you can leave this option disabled.
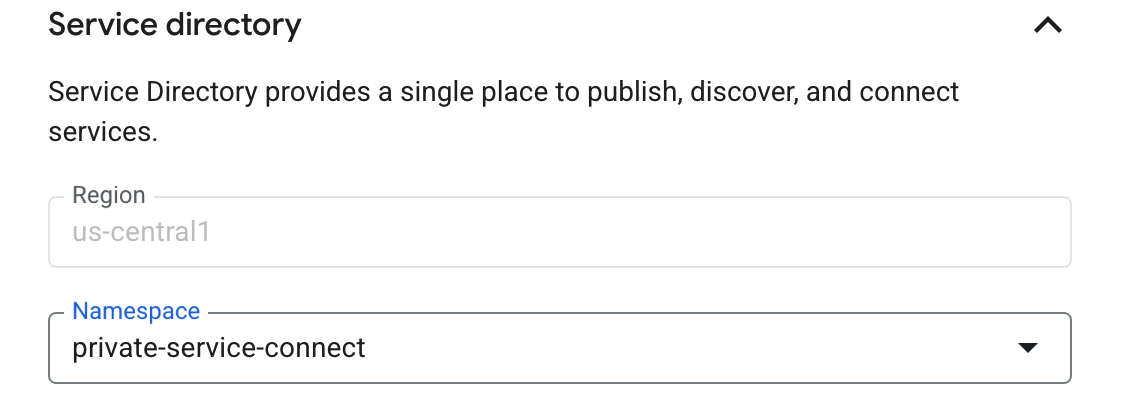
Open the Service Directory option and select a Namespace from the drop-down list or create a new namespace for the region. The Region is populated based on the selected Subnetwork. Service Discovery configures a private DNS zone for
<region>-psc.grafana.netand creates records for the endpoint. For example,grafana-fleet-management-us-central.us-central1-psc.grafana.net.![Configure Service Discovery]()
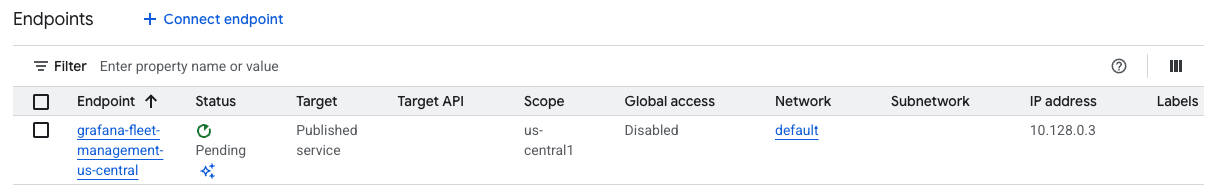
Click Add endpoint.
The new PSC endpoint is created.
![Waiting for endpoint to be create]()
After a short period of time, the endpoint status is set to Accepted.
Use Terraform
Use the following snippet to automate PSC Endpoint setup in GCP using Terraform:
locals {
    network_id    = "<your-network-id. eg. `default`>"
    subnetwork_id = "<your-subnetwork-id. eg. `default`>"

    service_discovery_namespace = "<your-sd-namespace-id. eg `private-service-connect`>"

    endpoint_name              = "grafana-fleet-management-us-central"
    grafana_service_attachment = "<Service Attachment provided by Grafana. eg `projects/grafanalabs/regions/us-central1/serviceAttachments/us-central-0-psc-fleet-management-001`>"
    grafana_service_region     = "<GCP region where Grafana service is available. eg. `us-central1`>"
}

# IP Address
resource "google_compute_address" "psc-grafana-fleet-mgmt-us-central" {
  name         = local.endpoint_name
  region       = local.grafana_service_region
  subnetwork   = local.subnetwork_id
  address_type = "INTERNAL"
}

# PSC endpoint
resource "google_compute_forwarding_rule" "psc-grafana-fleet-mgmt-us-central" {
  name                    = local.endpoint_name
  region                  = local.grafana_service_region
  load_balancing_scheme   = "" # Explicit empty string required for PSC
  target                  = local.grafana_service_attachment
  network                 = local.network_id
  subnetwork              = local.subnetwork_id
  ip_address              = google_compute_address.psc-grafana-fleet-mgmt-us-central.id
  allow_psc_global_access = true
  service_directory_registrations {
    namespace = local.service_discovery_namespace
  }
}
Secure your Fleet Management connections
Once you’ve created a PSC endpoint and associated it with the each service, use the private DNS names to secure your connections to Fleet Management and other Grafana Cloud services.
The private DNS name always follows the pattern <ENDPOINT_NAME>.<REGION>-psc.grafana.net.
Enroll collectors with PSC
Secure the connection of your collectors by adding the private DNS name to the remotecfg block in their local configurations.
- In your Grafana Cloud instance, navigate to Connections > Collector > Fleet Management.
- Switch to the API tab and scroll down to the AWS PrivateLink section.
- Locate and copy the Domain Name, which follows the pattern
<REGION>-psc.grafana.net. - Add your PSC endpoint name before the domain name to form the private DNS name.
For example,
grafana-fleet-management-us-central.us-central1-psc.grafana.net. - Access the local configuration file of each Alloy instance and add the private DNS Name as the value of the
urlargument in theremotecfgblock. For example:
remotecfg {
    url = "https://fleet-management-<ENDPOINT_NAME>.<REGION>-psc.grafana.net"
    basic_auth {
        username      = "<USERNAME>"
        password      = "<PASSWORD>"
    }

    id             = constants.hostname
    attributes     = {"cluster" = "dev", "namespace" = "otlp-dev"}
    poll_frequency = "5m"
}
Update configuration pipeline destination URLs
Self-monitoring pipelines and integration pipelines contain hardcoded destination URLs to Grafana Cloud services such as Prometheus and Loki. By default, these pipelines send data over the public internet. To route this data through your GCP PSC connection, you need to update the destination URLs in each configuration pipeline.
To update pipeline URLs, first find the private DNS names for each service:
- In your Grafana Cloud portal, click Details for the stack you want to privately connect.
- Click Details on the card for a service, for example, Prometheus.
- Scroll down until you see instructions for sending data with GCP Private Service Connect.
- Locate and copy the Domain Name, which follows the pattern
<REGION>-psc.grafana.net. - Add the PSC endpoint name for the service before the domain name to form the private DNS name.
For example,
grafana-prometheus-us-central.us-central1-psc.grafana.net. - Repeat for each service you want to connect.
Next, replace the hardcoded URLs with the private DNS names:
- In your Grafana Cloud instance, navigate to Connections > Collector > Fleet Management.
- Switch to the Remote configuration tab.
- For each self-monitoring pipeline, such as
self_monitoring_metrics, and any integration pipelines you have:- Click the Edit icon in a pipeline row.
- Look for URL references to Grafana Cloud services (for example,
prometheus-*.grafana.netorlogs-*.grafana.net). - Update these URLs to use the private DNS names for your Grafana Cloud services.
- Save the configuration pipeline.
- Repeat for each pipeline with hardcoded URLs.
Make direct API calls with PSC
To make secure calls to the Collector API, substitute the private DNS name in its base URL. For example:
https://fleet-management-<ENDPOINT_NAME>.<REGION>-psc.grafana.net/collector.v1.CollectorService/To make secure calls to the Pipeline API, substitute the private DNS name in its base URL. For example:
https://fleet-management-<ENDPOINT_NAME>.<REGION>-psc.grafana.net/pipeline.v1.PipelineService/

