Troubleshoot configuration pipeline issues
This page describes how to troubleshoot issues you might have with your configuration pipelines.
Error in configuration pipeline
You can identify and fix configuration errors from the collector detail view in the Grafana Fleet Management application. Refer to Troubleshoot remote configuration errors for more information.
Configuration pipeline was deleted from application
To recover a deleted configuration pipeline, view the pipeline’s history and recreate it:
- In the Fleet Management application, navigate to the Remote configuration tab.
- Switch to the Pipelines history view.
- Search for the deleted configuration pipeline using its name, ID, or matching attributes.
- Click into the deletion event and copy the configuration pipeline content.
- Make note of the matching attributes assigned to the pipeline.
- Switch back to the Remote configuration view and click Create configuration pipeline.
- Paste the configuration syntax, give it a name, and add the matching attributes.
Note
Deleted pipelines must be recreated manually. You can restore versions of existing pipelines on the History details page accessed from the Pipelines history view.
If you delete one of the autogenerated self-monitoring pipelines, you can also recreate it by deleting the other pipelines named self_monitoring_*.
Once the last autogenerated pipeline is deleted, the Grafana Fleet Management service recreates them all.
If you do not want to use the self-monitoring pipelines, switch them off in the Fleet Management interface rather than deleting them.
Configuration pipeline is no longer matched to collector
Configuration pipelines are assigned to collectors based on matching attributes. If a collector is no longer receiving a configuration pipeline, view the pipeline history to see if changes were made to its matching attributes.
- In the Fleet Management application, navigate to the Remote configuration tab.
- Switch to the Pipelines history view.
- Search for the related configuration pipeline using its name or ID.
- Review the events around the time the issue began, looking for changes in the Matching attributes column.
If no changes were made to the matching attributes of the pipeline, the change must have been made to the collector’s attributes.
Configuration pipelines can’t be edited
If the application’s editing functions, such as creating, modifying, or deleting configuration pipelines, are disabled, confirm with your organization’s administrator that you have the necessary permissions. Fleet Management supports role-based access control, and some roles disable all editing functionality, allowing read access only.
Data isn’t flowing as expected
When data isn’t flowing as expected, whether it’s no data, not enough data, or more than expected data, check to see if a change in a configuration pipeline might be the cause.
- In the Fleet Management application, navigate to the Remote configuration tab.
- Switch to the Pipelines history view.
- Search for the related configuration pipeline using its name, ID, or matching attributes.
- Click into the events that occurred around the time the data issue began.
- Compare versions of the pipelines using the Diff view until you find the issue.
- To roll back the change, click the Restore button above the correct version.
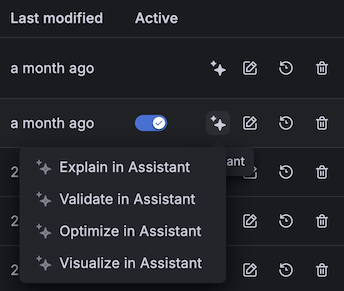
You can also use Grafana Assistant to validate and optimize your configuration pipelines.
Note
If you don’t see the Grafana Assistant icon or the icon is disabled, Assistant has not been enabled on your stack. Contact your stack administrator for more details.
In the Fleet Management application, navigate to the Remote configuration tab.
Search for the configuration pipeline using its name, ID, or matching attributes.
Click the Assistant icon and select the task you’d like it to perform, such as Validate in Assistant or Optimize in Assistant. Each task begins with a pre-configured prompt to get you started. You can use the initial output or continue the conversation in the Assistant window.
![One section of the Remote configuration page in the Fleet Management interface in Grafana Cloud where a menu shows the tasks that Grafana Assistant can perform on the selected configuration pipeline. The four options are Explain in Assistant, Validate in Assistant, Optimize in Assistant, and Visualize in Assistant.]()
If you intentionally make a configuration change to a pipeline, but the data doesn’t reflect the change, check to make sure Alloy was able to fetch and load the new configuration successfully.
- In the Fleet Management application, navigate to the Inventory tab.
- Click on the row of a collector that matches to the updated pipeline.
- In the details view, switch to the Logs tab.
- Check the Alloy logs for an error message such as
msg="failed to fetch remote configuration from the API" service=remotecfg. The log message should also indicate the reason for the failure. For example, a component is missing or an authentication error occurred.
Note
When a
GetConfigrequest fails, Alloy continues running by using a cached version of the last successfully loaded configuration. Refer to the architecture documentation for more information.
For tips on avoiding configuration rollout problems, refer to Minimize risk by deploying configuration pipelines in stages.
Data isn’t displaying correctly
If your dashboard no longer displays data as you expect, check to see if a configuration change, such as updated relabeling rules, is the cause. Use the Pipelines history feature to review changes to your configuration pipelines. Refer to Data isn’t flowing as expected for guidance on finding pipelines and reverting changes.
Top-level configuration block gives error
Remote configuration does not support top-level configuration blocks. If you want to use a top-level block, you must add the block to the collector’s local configuration file.


