
Preconfigured dashboards and alerts
Cloud Provider Observability provides the following preconfigured dashboards and alerts for you to install in your Grafana Cloud instance. These dashboards are embedded in and accessible in the AWS Observability section of Cloud Provider Observability in Grafana Cloud.
Preconfigured dashboards
Preconfigured dashboards are available for the following AWS services:
- AWS API Gateway: View visualizations for your Amazon API Gateway metrics in Grafana Cloud, including the following metrics: requests, errors, and latency.
- AWS Billing: View visualizations for your AWS Billing metrics in Grafana Cloud, including the following metrics: monthly and daily estimated totals and number of active services.
- AWS CloudFront: View visualizations for your Amazon CloudFront metrics in Grafana Cloud, including the following metrics: requests, error rates, and bytes downloaded and uploaded.
- AWS DynamoDB: View visualizations for your Amazon DynamoDB metrics in Grafana Cloud, including the following metrics: total tables, system errors, successful request latency, failed conditional writes, provisioned and consumed read/write capacity utilization, account max reads and writes, and returned item count.
- AWS EBS: View visualizations for your Amazon Elastic Block Store metrics in Grafana Cloud, including the following metrics: volume read and write bandwidth and throughput, volume idle time, volume total read and write time, volume queue length, and burst balance data.
- AWS EC2: View visualizations for your Amazon Elastic Compute Cloud metrics in Grafana Cloud. For more information on the metrics included and how to optimize your resources using them refer to AWS EC2 dashboard.
- AWS ECS: View visualizations for your Amazon Elastic Container Service metrics in Grafana Cloud, including the following metrics: CPU and memory utilization, and reservation statistics for CPU, memory, and GPU.
- AWS ElastiCache: View visualizations for your Amazon ElastiCache metrics in Grafana Cloud, including the following metrics: auth failures, CPU utilization, replication lag, DB memory usage, current connections, number of cache nodes and cache clusters, engine CPU utilization, swap usage, hit rates, evictions, memory fragmentation ration,
pubsublatency, network bytes in/out, and get type/hash based commands. - AWS ELB Application Load Balancer: View visualizations for your Amazon Elastic Load Balancing Application Load Balancer metrics instances including the following metrics: request and connection count, target response time, HTTP code target and elastic load balancers, consumed load balancer capacity units, processed bytes, rule evaluations, authorizations, and TLS negotiation errors.
- AWS ELB Network Load Balancer: View visualizations for your Amazon Elastic Load Balancing Network Load Balancer metrics in Grafana Cloud, including the following metrics: total number of load balancers, healthy and unhealthy host count, flow count, TLS flow count, consumed load balancer capacity units, processed bytes, TLS negotiation errors, and TCP connection reset counts.
- AWS Kafka: View visualizations for your Amazon Managed Streaming for Apache Kafka metrics instances including the following metrics: connection count, partitions, zoo keeper session state, leader count, active controller per cluster, under replicated partitions, offset lag average, zoo keeper request latency, global topic count average, and cluster metrics.
- AWS Lambda: View visualizations for your AWS Lambda metrics in Grafana Cloud, including the following metrics: lambda function count, total errors and invocations, function duration, throttles, error rate, destination delivery failures,
asyncevents data, as well as function instance data. - AWS NAT Gateways: View visualizations of your Amazon Network Address Translation service metrics in Grafana Cloud, including the following metrics: dropped packets, port allocation errors, and idle timeouts data.
- AWS RDS: View visualizations for your Amazon Relational Database Service metrics in Grafana Cloud, including the following metrics: number of DB instances, average burst balance, ReadIOPs, and instances with high CPU utilization.
- AWS S3: View visualizations for your Amazon Simple Storage Service metrics in Grafana Cloud, including the following metrics: number of objects, bucket size, request metrics such as number of requests, latency, and error information.
- AWS SES: View visualizations for your Amazon Simple Email Service metrics in Grafana Cloud, including the following metrics: send and delivery average, bounce and reject rates, and complaints data.
- AWS SQS: View visualizations for your Amazon Simple Queue Service metrics in Grafana Cloud, including the following metrics: messages data such as number of sent, received, and deleted messages, age of oldest messages, approximate number of messages, and sent message size.
- AWS VPN: View visualizations for your AWS Virtual Private Network metrics in Grafana Cloud, including the following metrics: VPN tunnel state, amount of data received and sent.
Note
The preconfigured dashboard for AWS ELB Classic Load Balancer metrics was deprecated.
Preconfigured alerts
When you configure CloudWatch metrics, the following prebuilt alerts are available.
AWS DynamoDB
- AwsDynamoDBConditionalCheckFailedRequests: Fires if there is a high number of conditional check failed requests on the table that could indicate issues with the application logic or data inconsistency in DynamoDB.
- AwsDynamoDBHighNumberOfThrottledRequests: Fires if there is a high number of throttle requests, meaning the specified table is receiving more traffic than what it can handle based on the provisioned read and write capacity. This issue can lead to slower performance and failures in your application. You need to increase provisioned capacity if necessary or switch to On-Demand mode.
- AwsDynamoDBHighReadCapacityUtilization: Fires if the DynamoDB account read quota utilization is high, meaning the account-level provisioned read capacity limit is being approached in the specified region. This affects ALL provisioned DynamoDB tables in that region and prevents further table provisioning/scaling. You need to check Service Quotas for DynamoDB Read Capacity in the specified region.
- AwsDynamoDBHighSystemErrors: Fires if there are high system errors, meaning there were internal issues with the specified table while executing the specified operation.
- AwsDynamoDBHighWriteCapacityUtilization: Fires if the DynamoDB account write quote utilization is high, meaning the account-level provisioned write capacity limit is being approached in the specified region. This affects ALL provisioned DynamoDB tables in that region and prevents further table provisioning/scaling. You need to check Service Quotas for DynamoDB Write Capacity in the specified region.
AWS EBS
- AwsEBSHighVolumeUtilization: Fires if there EBS volume utilization is too high. You need to increase IOPS or resize the EBS volume for better performance.
- AwsEBSHighVolumeQueueLength: Fires if you need to investigate whether the workload exceeds the provisioned IOPS or if there are inefficiencies in the application. You need to resize or upgrade the specified volumes to handle the queue.
- AwsEBSLowBurstBalance: Fires if EBS volume burst balance is low. You need to upgrade the EBS volume to a provisioned IOPS volume for consistent performance.
- AwsEBSLowIdleTime: Fires if there is very low idle time. You need to investigate processes causing high disk usage on the volume.
AWS EC2
- AwsEC2HighCpuUtilization: Fires if CPU utilization is too high for your EC2 instance indicating it is under heavy load and may become unresponsive.
- AwsEC2StatusCheckFailed: Fires if the EC2 instance status check fails. You need to view the AWS EC2 health checks and investigate underlying issues for the specified instance.
AWS Kafka
- AwsKafkaActiveControllerCount: Fires if the cluster does not have exactly one active controller, meaning the specified clusters have a controller issue.
- AwsKafkaHighRootDiskUsed: Fires if root disk used percentage is too high, meaning the specified broker’s root disk is almost at capacity and needs to have free space increased.
- AwsKafkaHighSystemCpu: Fires if system CPU is too high, meaning the specified cluster is under heavy load and may become unresponsive.
- AwsKafkaOfflinePartitions: Fires if offline partitions are detected in a specified cluster.
- AwsKafkaPatitionUnderReplicated: Fires if under replicated partitions are detected in the specified cluster.
AWS Lambda
- AwsLambdaInvocationFailures: Fires if Lambda invocation failures are detected in the specified function. This issue indicates errors in function execution that may affect application functionality.
- AwsLambdaThrottlingEvents: Fires if Lambda function throttling is detected in the specified function due to concurrency limits. This issue may cause request failures and degraded performance.
AWS RDS
- AwsRDSDiskIOPSBottleneck: Fires if there is a disk IOPS bottleneck detected. You need to upgrade the specified instances to Provisioned IOPS storage (gp3/io1) or investigate inefficient queries.
- AwsRDSHighCpuLoad: Fires if sustained high CPU load is detected on your RDS instance. You need to scale up the specified instance, optimize queries, or investigate long-running queries.
- AwsRDSHighCpuSpikes: Fires if unexpected CPU spikes are detected on your RDS instance that may be causing latency issues or throttling.
- AwsRDSReadReplicaLag: Fires if RDS replicas are too slow.
Install AWS preconfigured dashboards and alerts
To install and view your AWS preconfigured dashboards and alerts:
- After configuring a CloudWatch metrics scrape or stream job, click the Configuration tab at the top of the Cloud Provider AWS page.
- Scroll down to the Dashboards and Alerts Installation section and click Install dashboards and alerts.
- Click the Services tab.
- Locate and click the specific service or source you want to see a dashboard for in the list. Use the Service or Source filters to help you find the source or service you want to see.
Refine dashboard data
You can use the following filters on dashboards to refine your data:
- Data source
- Job
- Resource group
- Subscription name
- Resource name
Additionally, use the time range selector to change time period of your data.
Access Nodes in Kubernetes accounts
From EC2 instance pages in Cloud Provider Observability, you can navigate to Node or Cluster detail pages for AWS managed Kubernetes in Kubernetes Monitoring.
The Kubernetes detail pages includes details about the Kubernetes Node or Cluster your EC2 instance is on including the following details: Cluster and Pod information, OS and kubelet version, and optimization metrics such as CPU and memory requests and capacity.
To drilldown into the AWS managed Kubernetes Node or Cluster details of an EC2 instance, complete the following steps:
From the Services tab in Cloud Provider AWS, find and select AWS/EC2.
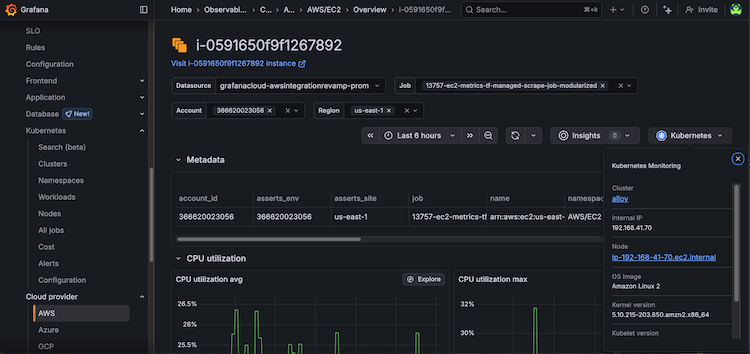
Select the EC2 instance from the Service column to open the instance overview page.
On the far right-side of the instance overview page, click the Kubernetes drop-down button and the Node link to open the Node overview or the Cluster link to open the Cluster overview.
![EC2 instance overview page with Kubernetes drop-down and Node and Cluster links]()
To return to the Cloud Provider AWS Monitoring view of the instance:
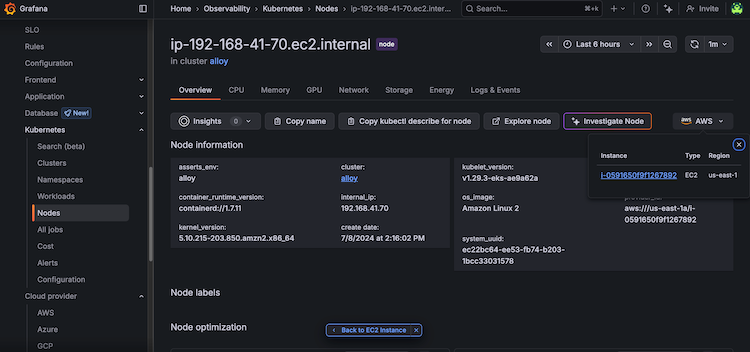
On the Kubernetes Node overview page, click the AWS drop-down and the EC2 instance link or click the Back to EC2 Instance button.
![Kubernetes Node overview page with AWS drop-down and EC2 instance link]()
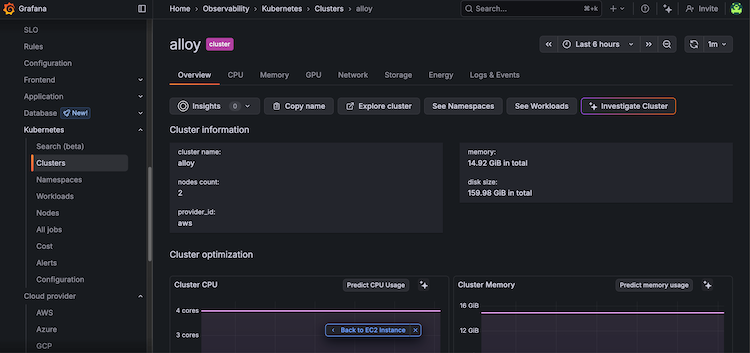
On the Kubernetes Cluster overview page, click the Back to EC2 Instance button.
![Kubernetes Cluster instance overview page with Back to EC2 Instance link]()
To learn more about what information is available about the Kubernetes Cluster or Node, refer to Explore your infrastructure with Kubernetes Monitoring.
Manage alerts
To view alerts, navigate to the Alerts tab.
To see a recommendation for alert resolution, click the tooltip in the row of the Summary column.
In the Alert column, click the alert to view the dashboard for that service.


