Host-hours pricing for Kubernetes Monitoring
Kubernetes Monitoring is now established as a core Grafana Cloud application, and its usage is billed separately.
Definition of active host or container
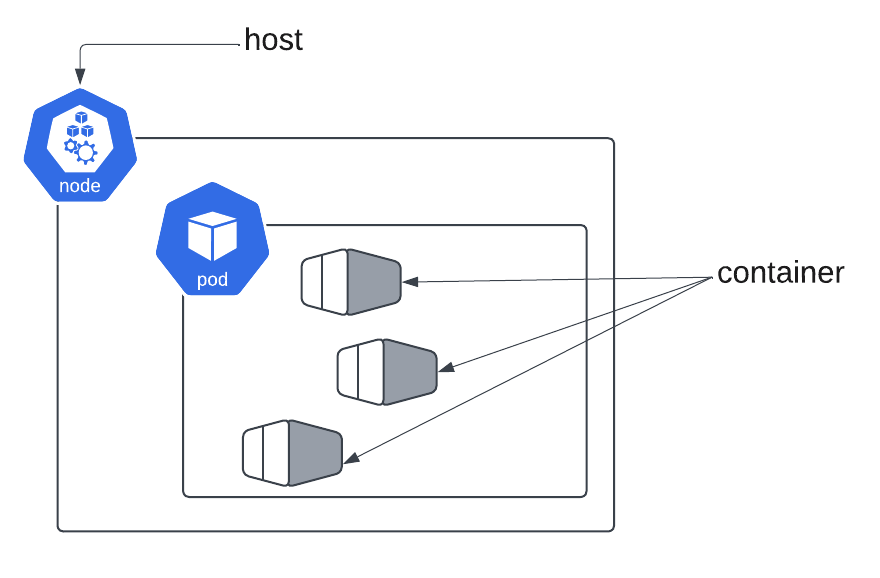
An active host or active container is any Kubernetes Node (whether it’s a virtual machine or a physical machine) or container actively sending observability signals using kube-state-metrics.
Billable host hours are the total time that active hosts and active containers are monitored each month.
What is not a host
A Pod (a group of one or more containers) is not considered a host. Pods run within Nodes, which are the actual hosts.
How hours are tracked
Usage tracking begins whenever a host (a node) or a container is actively sending kube-state-metrics to Grafana Cloud.
As soon as one minute of host or container activity is captured, your billing begins. The minumum Grafana tracks activity is 15 minutes plus the active time of the host or container.
Billable hours are the sum of the time that active hosts send monitoring signals to Grafana Cloud during the month.
For greater detail, refer to Understand your Kubernetes Monitoring invoice.
Windows nodes
If you are running Windows nodes within a Kubernetes Cluster, you are billed for host hours if kube-state-metrics is present within the same Cluster.
Non-Prometheus telemetry data
If you use OTel-style telemetry or other data collection methods (such as VictoriaMetrics) with Kubernetes Monitoring, these methods result in a partial or empty set of data. Without the data available from the kube-state-metrics exporter, active nodes and containers can’t be detected, and you won’t be billed for host hours.
Invoice
For more detailed information about host-hours billing and your invoice, refer to Understand your Kubernetes Monitoring invoice.
Usage after January 1, 2026
If you are a contract customer that started using Kubernetes Monitoring after January 1, 2026, Grafana Cloud calculates Kubernetes Monitoring usage based on active host and container hours in a calendar month.
Usage after September 17, 2024
If you are a self-serve customer and began using Kubernetes Monitoring in Grafana Cloud after September 17, 2024, Grafana Cloud calculates Kubernetes Monitoring usage based on active host and container hours in a calendar month that includes credits for telemetry.
Usage before September 17, 2024
If you have been using Kubernetes Monitoring in Grafana Cloud prior September 17th, 2024, and you are:
- A self-serve customer, you are billed for active billable series based on the underlying metrics generated. You will remain on this billing model unless you want to migrate to the hourly pricing model. Contact the support team to request moving to the hourly billing model.
- A contract customer, your account team will work with you to transition to the new host-hours model.


