Configure remote_write with a Prometheus ConfigMap
If you have Prometheus installed and running in your cluster, and you configured using a Kubernetes ConfigMap, you can send scraped samples to Grafana Cloud using Prometheus’s remote_write feature.
Before you begin
Before you begin, you must have the following items:
- A Kubernetes
>=1.16.0cluster. - A Grafana Cloud Standard account. To create an account, refer to Get started.
- A Grafana Cloud access policy token with the
metrics:writescope. To create a Grafana Cloud access policy, refer to Create a Grafana Cloud Access Policy. - The
kubectlcommand-line tool installed on your local machine and configured to connect to your cluster. To install, refer to installkubectl. - The Prometheus monitoring system installed and running in your cluster as a Deployment, configured using a ConfigMap
To install Prometheus Operator in your cluster, refer to Install Prometheus Operator with Grafana Cloud for Kubernetes. Prometheus Operator abstracts away much of Prometheus’s configuration and management overhead.
Modify Prometheus ConfigMap
To locate your Grafana Cloud Metrics username and password, navigate to your stack in the Cloud Portal and click Details next to the Prometheus panel.
Your password corresponds to a Cloud Access Policy token that you can generate by clicking on Generate now in this same panel. To create a Cloud Access Policy, refer to Create a Grafana Cloud Access Policy.
Note your username and password.
To inject your username and password into your Prometheus configuration file, modify the Kubernetes ConfigMap resource which contains Prometheus’s configuration.
Unfortunately Prometheus does not support pulling environment variables from the execution environment. Therefore, you cannot readily use a Kubernetes Secret object in this case. Using Secrets or
envsubstgoes beyond the scope of this content.Locate the ConfigMap manifest and open it in an editor. It will look similar to the following example. This ConfigMap is installed in the
monitoringNamespace, where the Prometheus Deployment should also be running.apiVersion: v1 kind: ConfigMap metadata: name: prometheus namespace: monitoring data: prometheus.yml: |- global: scrape_interval: 5s evaluation_interval: 5s rule_files: - /etc/prometheus/prometheus.rules alerting: alertmanagers: - scheme: http static_configs: - targets: - "alertmanager.monitoring.svc:9093" . . .Modify this ConfigMap by adding the following
remote_writeconfiguration block:apiVersion: v1 kind: ConfigMap metadata: name: prometheus_v2 namespace: monitoring data: prometheus.yml: |- global: scrape_interval: 5s evaluation_interval: 5s . . . remote_write: - url: <Your Metrics instance remote_write endpoint> basic_auth: username: <your_grafana_cloud_metrics_username> password: <your_grafana_cloud_metrics_password>To find the
/api/prom/pushURL, username, and password for your metrics endpoint, click Details in the Prometheus card of the Cloud Portal.This block creates a default
remote_writeconfiguration that sends samples to the Cloud Metrics Prometheus endpoint. It also sets the authorization header onremote_writerequests with your Grafana Cloud credentials. To tune the defaultremote_writeparameters, refer to Remote Write Tuning.Make sure you give the ConfigMap a new versioned name as well. To do so, append a suffix like
_v2.Save and close the file.
Update the running Prometheus Deployment
To make your configuration changes in the cluster, update the Prometheus Deployment with the newly versioned ConfigMap.
Note
You can make configuration changes in Kubernetes clusters in many different ways. These steps focus on configuring
remote_write, and are not meant to cover blue-green or production Prometheus rollout scenarios.In the previous step, you assigned the ConfigMap a new name. When you update the ConfigMap reference in the Deployment, Kubernetes redeploys any Pods using the old ConfigMap.
Open the Prometheus Deployment in an editor. It will look similar to the following example. This file may vary depending on how you configured and deployed Prometheus. The above manifest defines a 2-Pod Prometheus Deployment that references a ConfigMap called
prometheus. Theprometheus.ymlkey containing Prometheus’s configuration is mounted to/etc/prometheus/prometheus.yml.apiVersion: apps/v1 kind: Deployment metadata: name: prometheus-deployment labels: app: prometheus spec: replicas: 2 selector: . . . template: metadata: labels: app: prometheus . . . spec: containers: - name: prometheus image: prometheus ports: - containerPort: 9090 volumeMounts: - name: config-volume mountPath: /etc/prometheus/ volumes: - name: config-volume configMap: name: prometheusTo update this Deployment, change the ConfigMap:
. . .
      volumes:
        - name: config-volume
          configMap:
            name: prometheus_v2
You update the
configMap’snamefield fromprometheustoprometheus_v2to reference the new ConfigMap defined earlier.When you’re done, save and close the file.
Roll out the changes using
kubectl apply -f:kubectl apply -f <your_prometheus_deployment_manifest>.yaml
Check your work
To verify that your running Prometheus instance is remote_writing correctly:
Get the Prometheus server’s service name:
kubectl get svcUse
port-forwardto forward a local port to the Prometheus service:kubectl --namespace monitoring port-forward svc/<prometheus-service-name> 9090:80Replace
monitoringwith the appropriate namespace, and<prometheus-service-name>with the name of the Prometheus service.Navigate to
http://localhost:9090in your browser, and then Status and Configuration.Verify that the
remote_writeblock you appended above has propagated to your running Prometheus instance configuration.Log in to your Grafana instance to begin querying your cluster data.
Navigate to Kubernetes Monitoring, and click Configuration on the main menu.
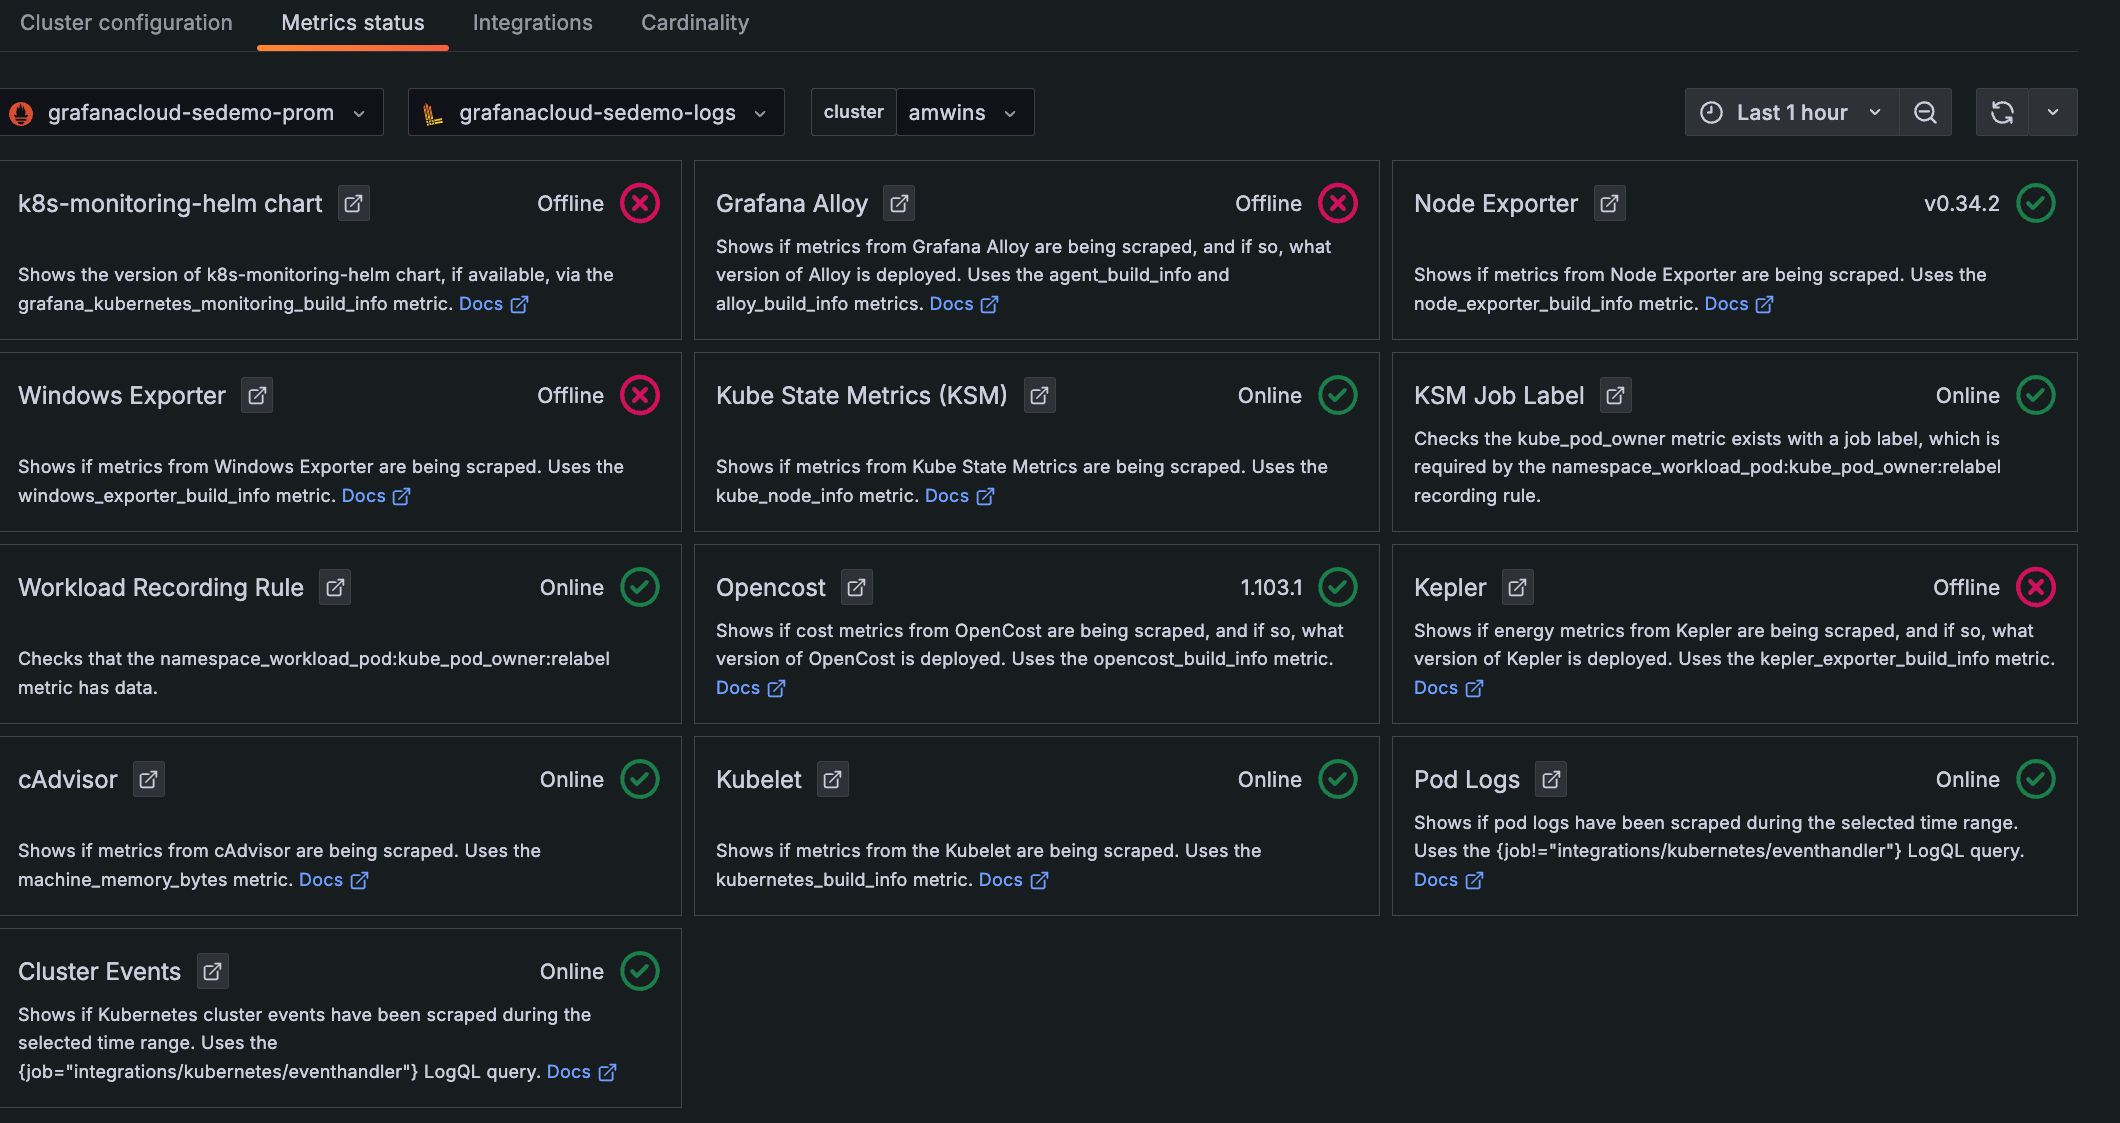
Click the Metrics status tab to view the data status. Your data begins populating in the view as the system components begin scraping and sending data to Grafana Cloud.
![**Metrics status** tab with status indicators for one Cluster Descriptions and statuses for each item chosen to be configured and whether they are online]()
Metrics status tab with status indicators for one Cluster


