
OpenAI Codex integration for Grafana Cloud
Track OpenAI Codex CLI usage, API requests, tool invocations, and performance metrics across your organization by exporting telemetry data through OpenTelemetry (OTel). Codex exports metrics, logs, and traces.
Install OpenAI Codex integration for Grafana Cloud
- In your Grafana Cloud stack, click Connections in the left-hand menu.
- Find and select the OpenAI Codex tile to open the integration.
- Follow the steps outlined on the Configuration page to set up telemetry and configure credentials.
- Once configuration is complete, click Install to add the prebuilt dashboards to your Grafana Cloud instance.
Configuration
The OpenAI Codex integration sends metrics, logs, and traces to Grafana Cloud via OpenTelemetry (OTLP HTTP),
configured through ~/.codex/config.toml.
Configure the integration
Follow these steps to set up OpenAI Codex for Grafana Cloud:
Create Grafana Cloud Token
- Generate a Grafana Cloud Access Policy Token with
metrics:write,logs:write, andtraces:writepermissions. - Copy the token value and store it securely.
- Generate a Grafana Cloud Access Policy Token with
Configure
~/.codex/config.tomlCreate or edit
~/.codex/config.tomland add the following, replacing the placeholder values with your Grafana Cloud credentials:[otel] environment = "production" log_user_prompt = false exporter = { otlp-http = { endpoint = "<your-grafana-cloud-otlp-endpoint>/otlp/v1/logs", protocol = "binary", headers = { "Authorization" = "Basic <base64-encoded-instanceid:token>" } }} metrics_exporter = { otlp-http = { endpoint = "<your-grafana-cloud-otlp-endpoint>/otlp/v1/metrics", protocol = "binary", headers = { "Authorization" = "Basic <base64-encoded-instanceid:token>" } }} trace_exporter = { otlp-http = { endpoint = "<your-grafana-cloud-otlp-endpoint>/otlp/v1/traces", protocol = "binary", headers = { "Authorization" = "Basic <base64-encoded-instanceid:token>" } }}Restart Codex after saving the file for changes to take effect. It may take a few minutes for data to appear in Grafana Cloud.
Install Dashboards
- Click Install to add the OpenAI Codex dashboards to your Grafana Cloud instance.
Finding your credentials
- OTLP Endpoint: Your endpoint is displayed in the integration configuration page. You can also find it in the Grafana Cloud portal under My Account → Stack details.
- Auth Header: Use
Basic <base64(instanceId:token)>whereinstanceIdis your OpenTelemetry instance ID andtokenis the Grafana Cloud Access Policy token generated above.
Dashboards
The OpenAI Codex integration installs the following dashboards in your Grafana Cloud instance.
- OpenAI Codex
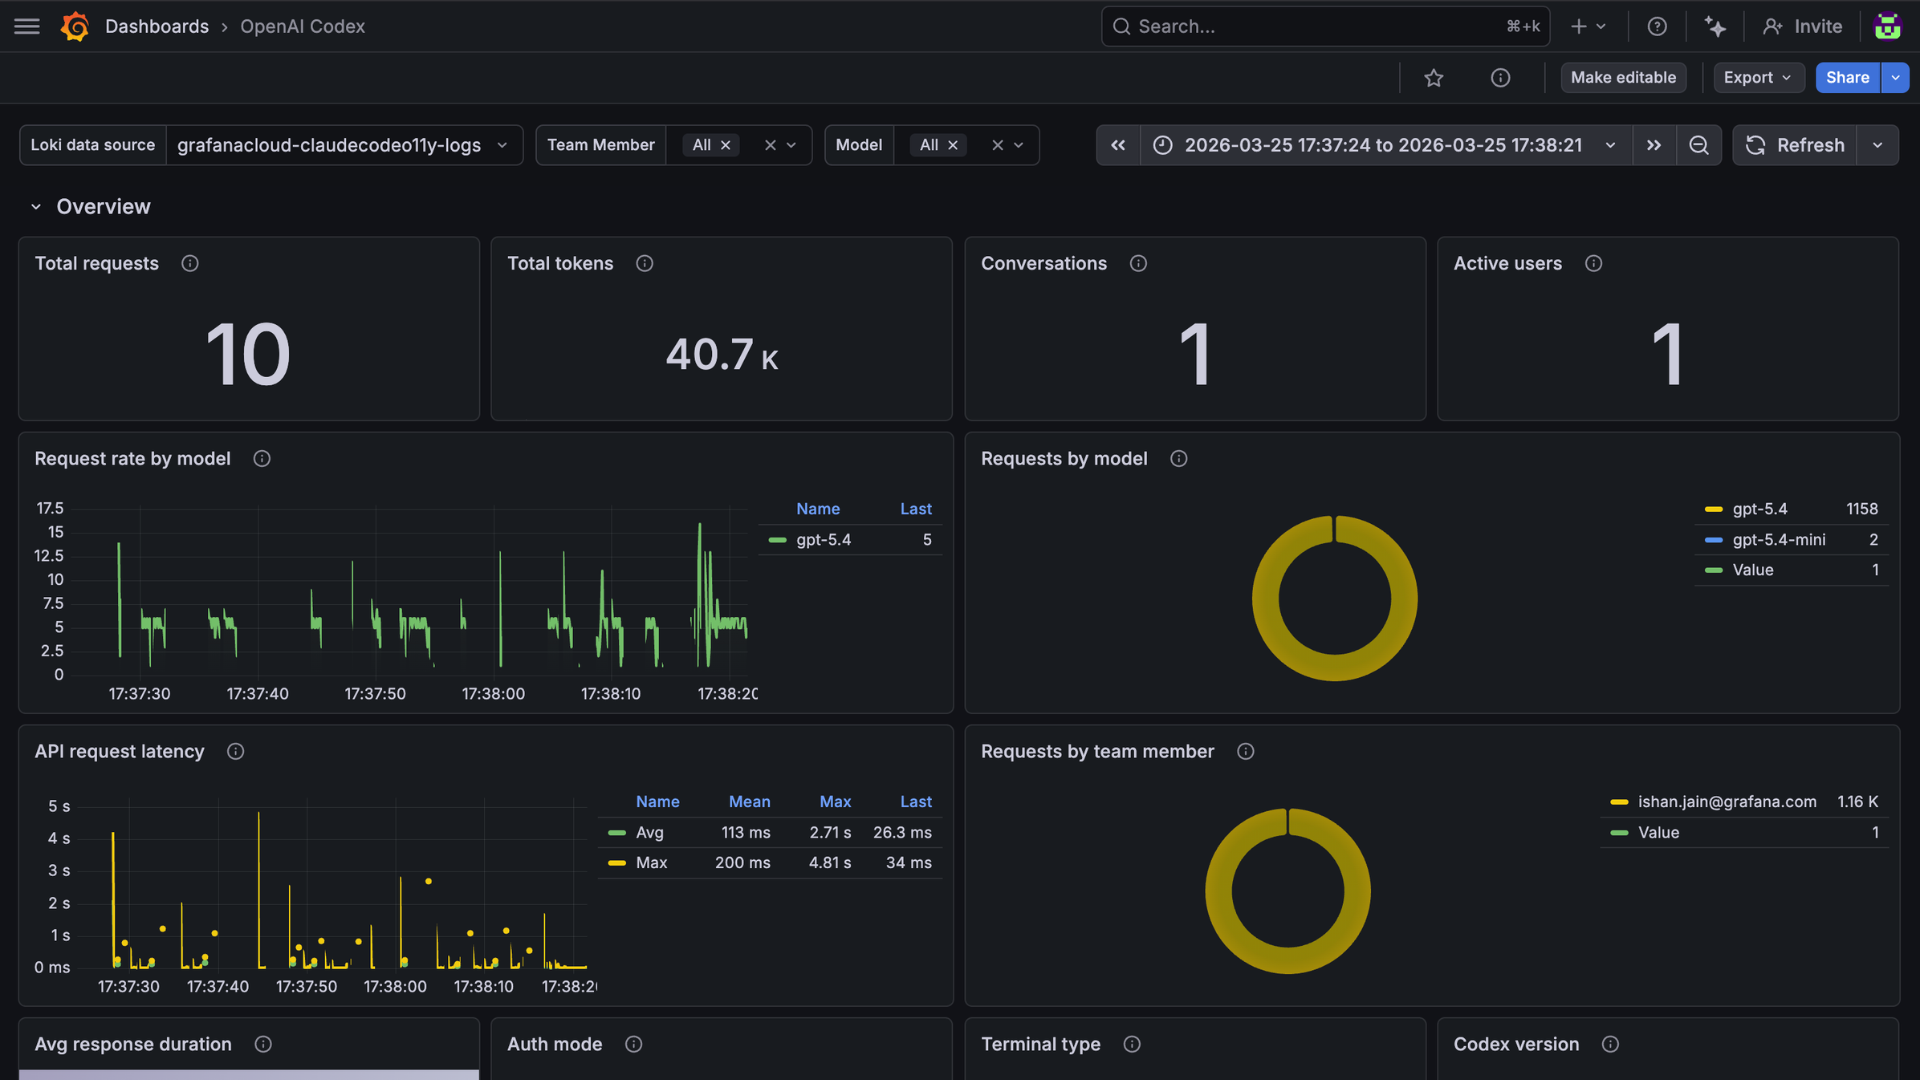
OpenAI Codex overview
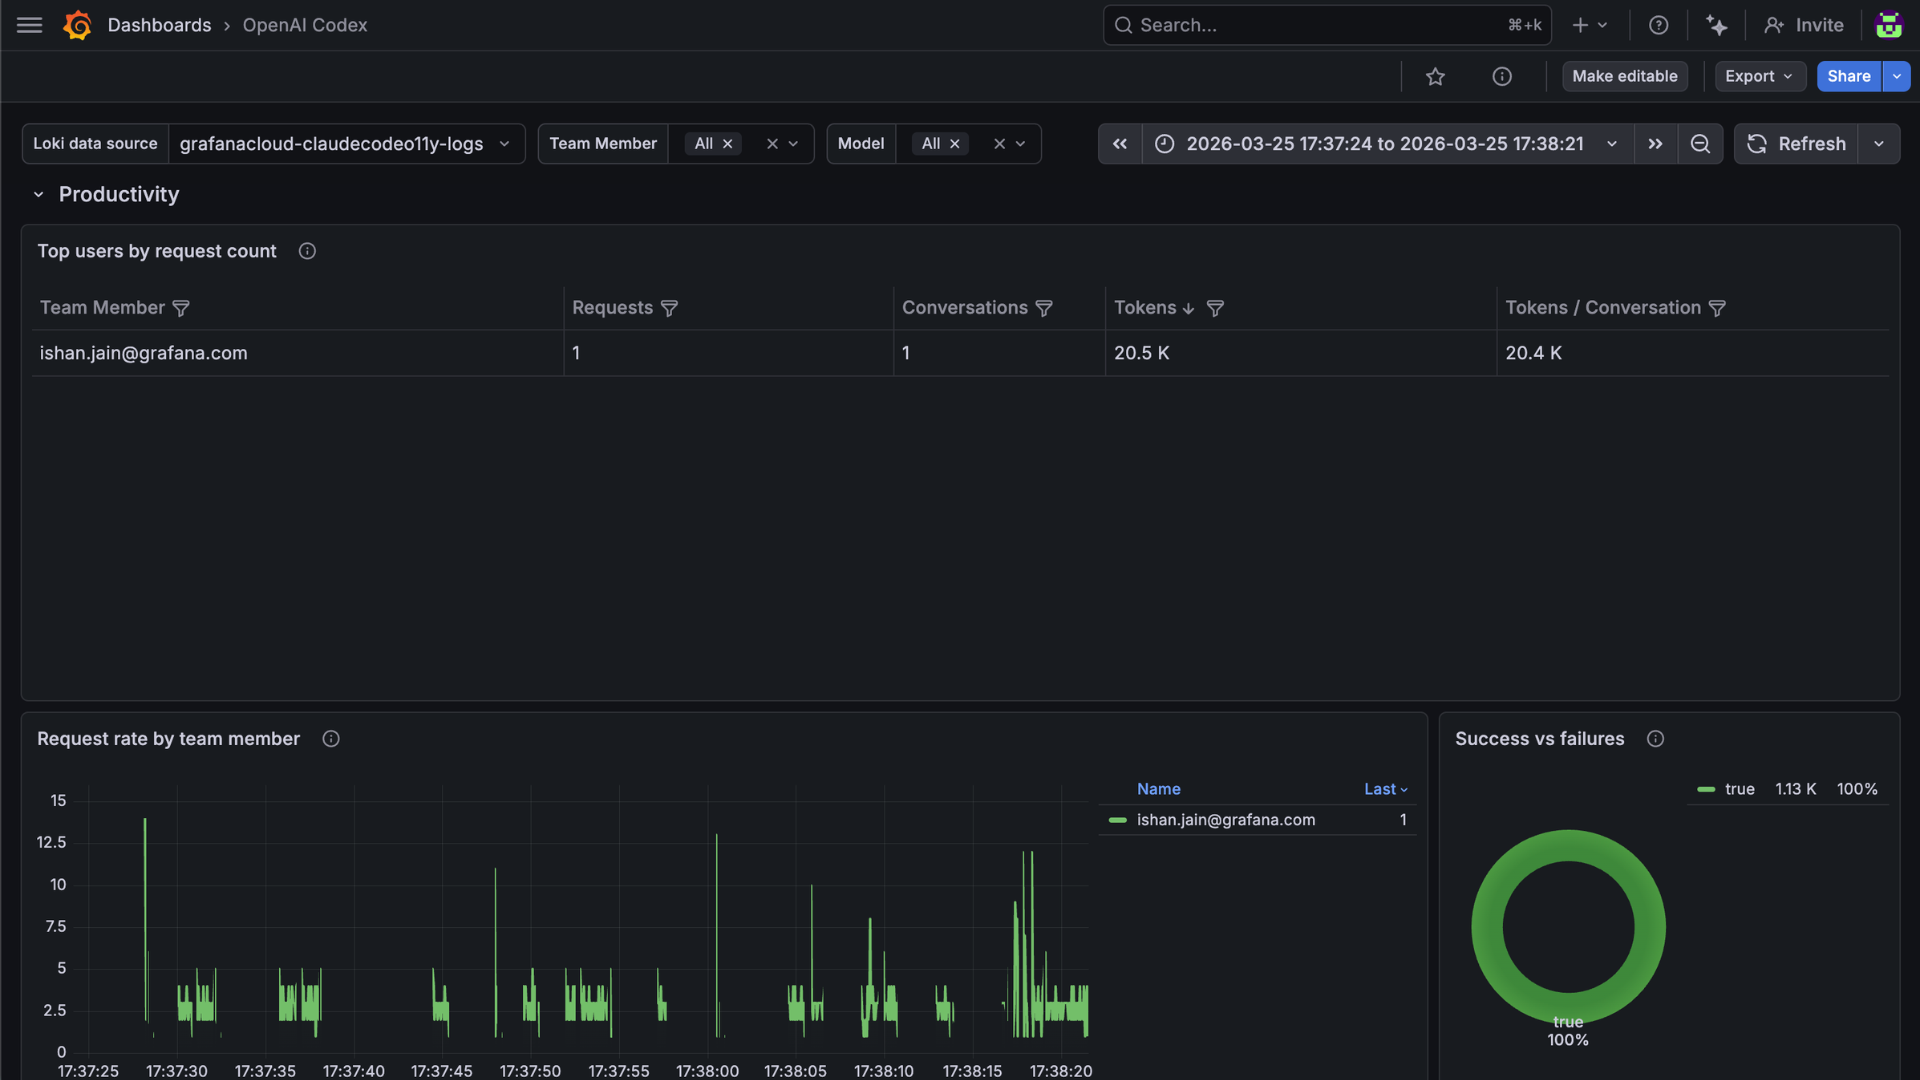
OpenAI Codex usage
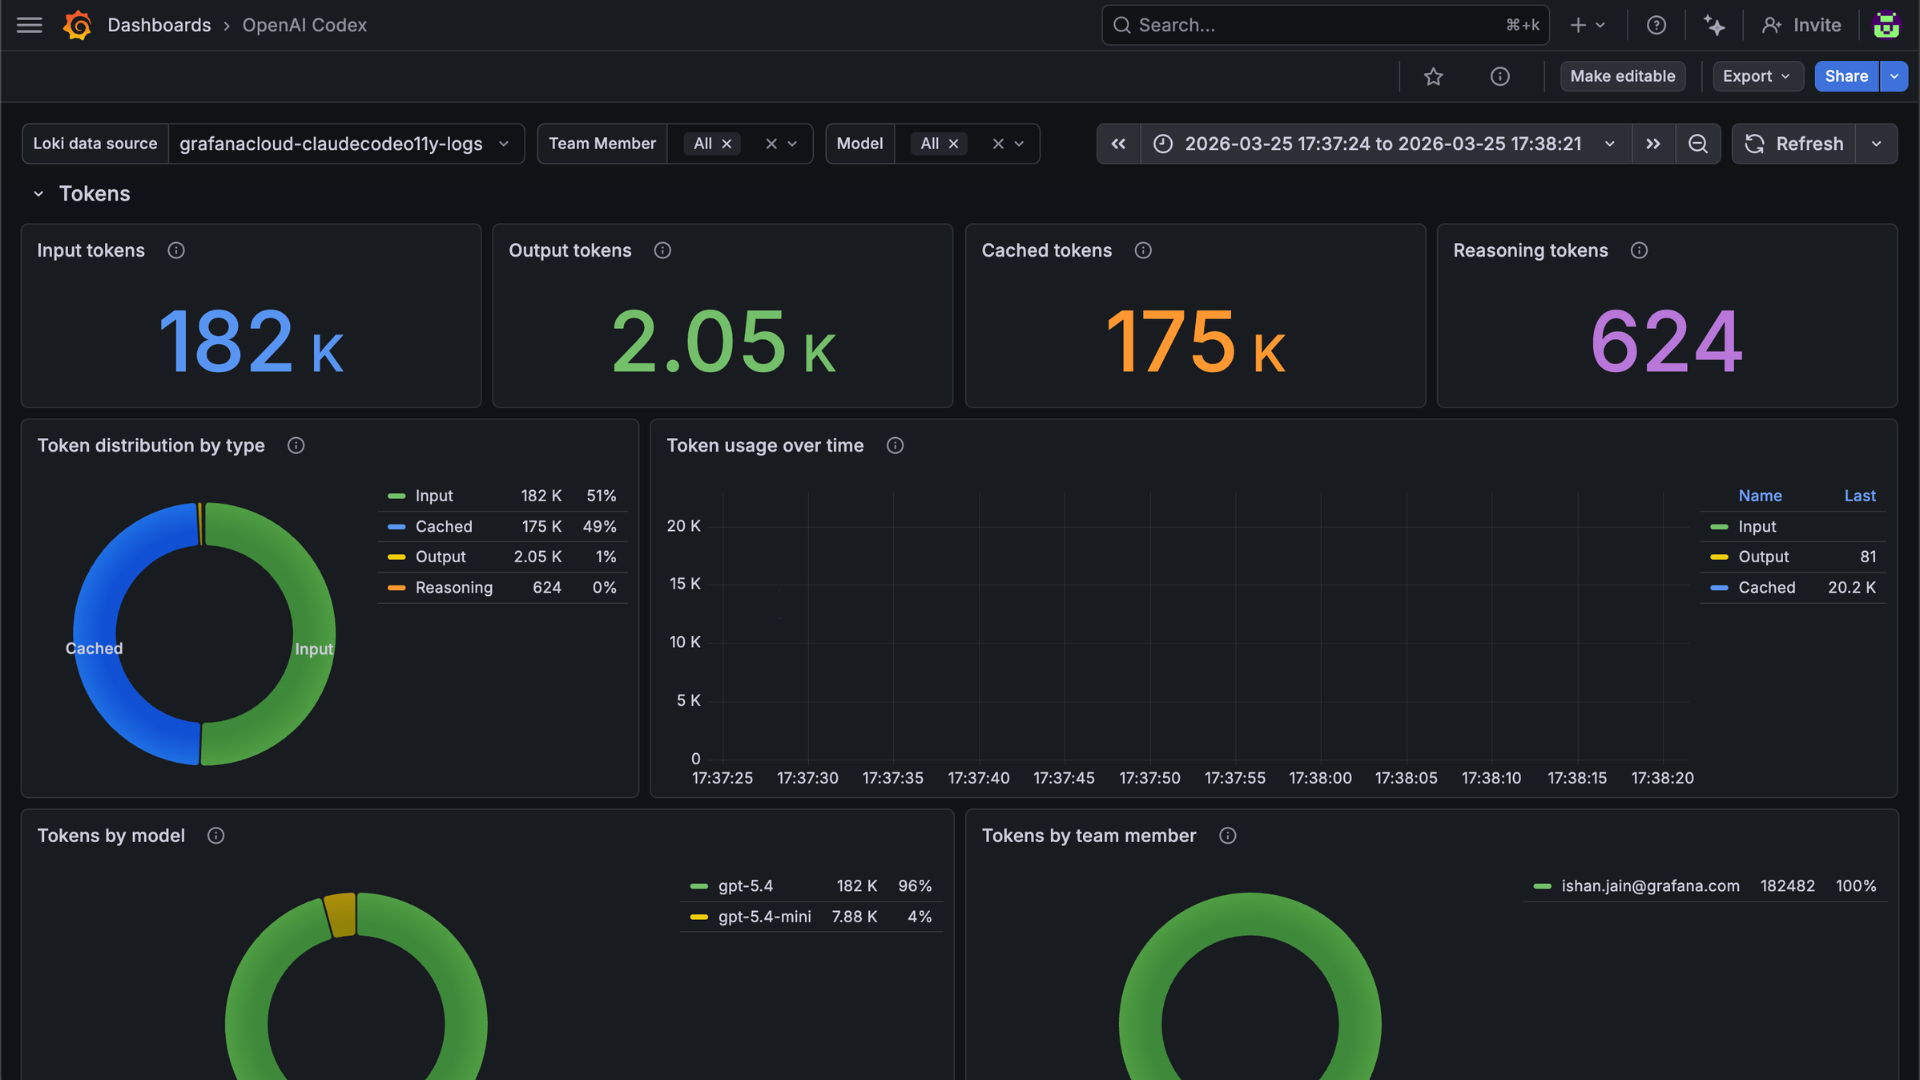
OpenAI Codex performance
Changelog
# 1.0.0 - March 2026

* Initial release of OpenAI Codex integration

