
Netflow integration for Grafana Cloud
Netflow, IPFIX and sFlow are protocols to analyze network traffic as it passes through a device. It is supported by a wide range of network systems and appliances.
This integration includes 1 pre-built dashboard to help monitor and visualize Netflow metrics.
Before you begin
This integration uses ktranslate to generate metrics from raw Netflow, IPFIX and sFlow packets.
The ktranslate host needs to be reachable from the device sending the Netflow data. It also needs to reach the host running the previously installed Alloy instance.
Both ktranslate and Alloy can run on the same host.
Install Netflow integration for Grafana Cloud
- In your Grafana Cloud stack, click Connections in the left-hand menu.
- Find Netflow and click its tile to open the integration.
- Review the prerequisites in the Configuration Details tab and set up Grafana Alloy to send Netflow metrics to your Grafana Cloud instance.
- Click Install to add this integration’s pre-built dashboard to your Grafana Cloud instance, and you can start monitoring your Netflow setup.
Configuration snippets for Grafana Alloy
Advanced mode
The provided snippet configures Alloy to listen for OTLP Traffic on port 4137 using the grpc transport protocol.
It also relabels the ktranslate rollup metric to conform to the OTEL Semantic conventions for network attributes.
Advanced integrations snippets
otelcol.receiver.otlp "default" {
  // configures the default grpc endpoint "0.0.0.0:4317"
  grpc { }
  output {
    metrics = [otelcol.processor.transform.preprocessing.input]
    logs = [otelcol.processor.resourcedetection.default.input]
    traces = [otelcol.processor.resourcedetection.default.input]
  }
}

otelcol.processor.transform "preprocessing" {
  error_mode = "ignore"

  log_statements {
    context = "resource"
    statements = [
      `set(attributes["service.name"], "integrations/ktranslate-netflow") where attributes["service.name"] == "ktranslate"`,
    ]
  }

  metric_statements {
    context = "metric"
    statements = [
      `set(metric.name,"network.io.by_flow") where metric.name == "kentik.rollup.bytes_by_flow"`,
      `set(resource.attributes["service.name"],"integrations/ktranslate-netflow") where metric.name == "network.io.by_flow"`,
      `set(metric.unit,"By") where metric.name == "network.io.by_flow"`,
    ]
  }

  metric_statements {
    context    = "datapoint"
    statements = [
      `set(datapoint.attributes["network.protocol.name"], datapoint.attributes["application"]) where metric.name == "network.io.by_flow"`,
      `delete_key(datapoint.attributes,"application") where metric.name == "network.io.by_flow"`,
      `set(datapoint.attributes["network.transport"], datapoint.attributes["protocol"]) where metric.name == "network.io.by_flow"`,
      `delete_key(datapoint.attributes,"protocol") where metric.name == "network.io.by_flow"`,
      `set(datapoint.attributes["network.local.country"], datapoint.attributes["src_country"]) where metric.name == "network.io.by_flow"`,
      `delete_key(datapoint.attributes,"src_country") where metric.name == "network.io.by_flow"`,
      `set(datapoint.attributes["network.peer.country"],datapoint.attributes["dst_country"]) where metric.name == "network.io.by_flow"`,
      `delete_key(datapoint.attributes,"dst_country") where metric.name == "network.io.by_flow"`,
      `set(datapoint.attributes["network.local.address"],datapoint.attributes["src_addr"]) where metric.name == "network.io.by_flow"`,
      `delete_key(datapoint.attributes,"src_addr") where metric.name == "network.io.by_flow"`,
      `set(datapoint.attributes["network.local.port"],datapoint.attributes["src_port"]) where metric.name == "network.io.by_flow"`,
      `delete_key(datapoint.attributes,"src_port") where metric.name == "network.io.by_flow"`,
      `set(datapoint.attributes["network.peer.address"],datapoint.attributes["dst_addr"]) where metric.name == "network.io.by_flow"`,
      `delete_key(datapoint.attributes,"dst_addr") where metric.name == "network.io.by_flow"`,
      `set(datapoint.attributes["network.peer.port"],datapoint.attributes["dst_port"]) where metric.name == "network.io.by_flow"`,
      `delete_key(datapoint.attributes,"dst_port") where metric.name == "network.io.by_flow"`,
      `delete_key(datapoint.attributes,"zone") where metric.name == "network.io.by_flow"`,
    ]
  }

  output {
    metrics = [otelcol.processor.resourcedetection.default.input]
  }
}

otelcol.processor.resourcedetection "default" {
  detectors = ["env", "system"]

  system {
    hostname_sources = ["os"]
  }

  output {
    metrics = [otelcol.processor.batch.default.input]
    logs    = [otelcol.processor.batch.default.input]
    traces  = [otelcol.processor.batch.default.input]
  }
}

otelcol.processor.batch "default" {
  output {
    metrics = [otelcol.exporter.otlphttp.grafana_cloud.input]
    logs    = [otelcol.exporter.otlphttp.grafana_cloud.input]
    traces  = [otelcol.exporter.otlphttp.grafana_cloud.input]
  }
}

otelcol.exporter.otlphttp "grafana_cloud" {
  client {
    endpoint = "<your-cloud-otlp-endpoint>"
    auth     = otelcol.auth.basic.grafana_cloud.handler
  }
}

otelcol.auth.basic "grafana_cloud" {
  username = "<your-cloud-instance-id>"
  password = "<your-access-token>"
}
Customize OTLP endpoint
You can customize the port for the OTLP receiver by adding a endpoint = 0.0.0.0:<your-port> attribute to the grpc block.
Set up ktranslate
Use the following snippet to run and configure ktranslate using a container runtime like docker or podman:
docker run -d --name="ktranslate" --cap-add net_raw --net=host quay.io/kentik/ktranslate:v2 \
  --format=otel \
  --otel.protocol=grpc \
  --otel.endpoint=http://localhost:4317/ \
  --nf.source=auto \
  --nf.port=9995 \
  --sinks=otel \
  --rollup_interval=60 \
  --tee_logs=true \
  --service_name=flow \
  --max_flows_per_message=100 \
  --rollups=s_sum,bytes_by_flow,in_bytes+out_bytes,src_addr,dst_addr,l4_src_port,l4_dst_port,protocol,custom_str.application,device_name,custom_str.src_host,custom_str.dst_host,src_geo,dst_geo \
  --rollup_top_k=10 \
  --rollup_keep_undefined=true
If you don’t have a container runtime available, you can download the ktranslate binary from the ktranslate GitHub project and run it directly.
When running Alloy on a different host to ktranslate, change --otel.endpoint=http://localhost:4317/ to the host and port of your Alloy instance.
By default, ktranslate will only save the ten flows with the highest traffic for each interval.
To customize this, change the --rollup_top_k=10 argument to a value that suits your situation.
Configure your devices
Configure your networking devices to send flows to the ktranslate host.
You can find instructions for popular vendors here:
Use the following configuration settings:
- Collector Address:
Address of ktranslate host - Collector Port:
9995 - Protocol Version:
Netflow 5 / Netflow 9 / IPFIX / sFlow
Dashboards
The Netflow integration installs the following dashboards in your Grafana Cloud instance to help monitor your system.
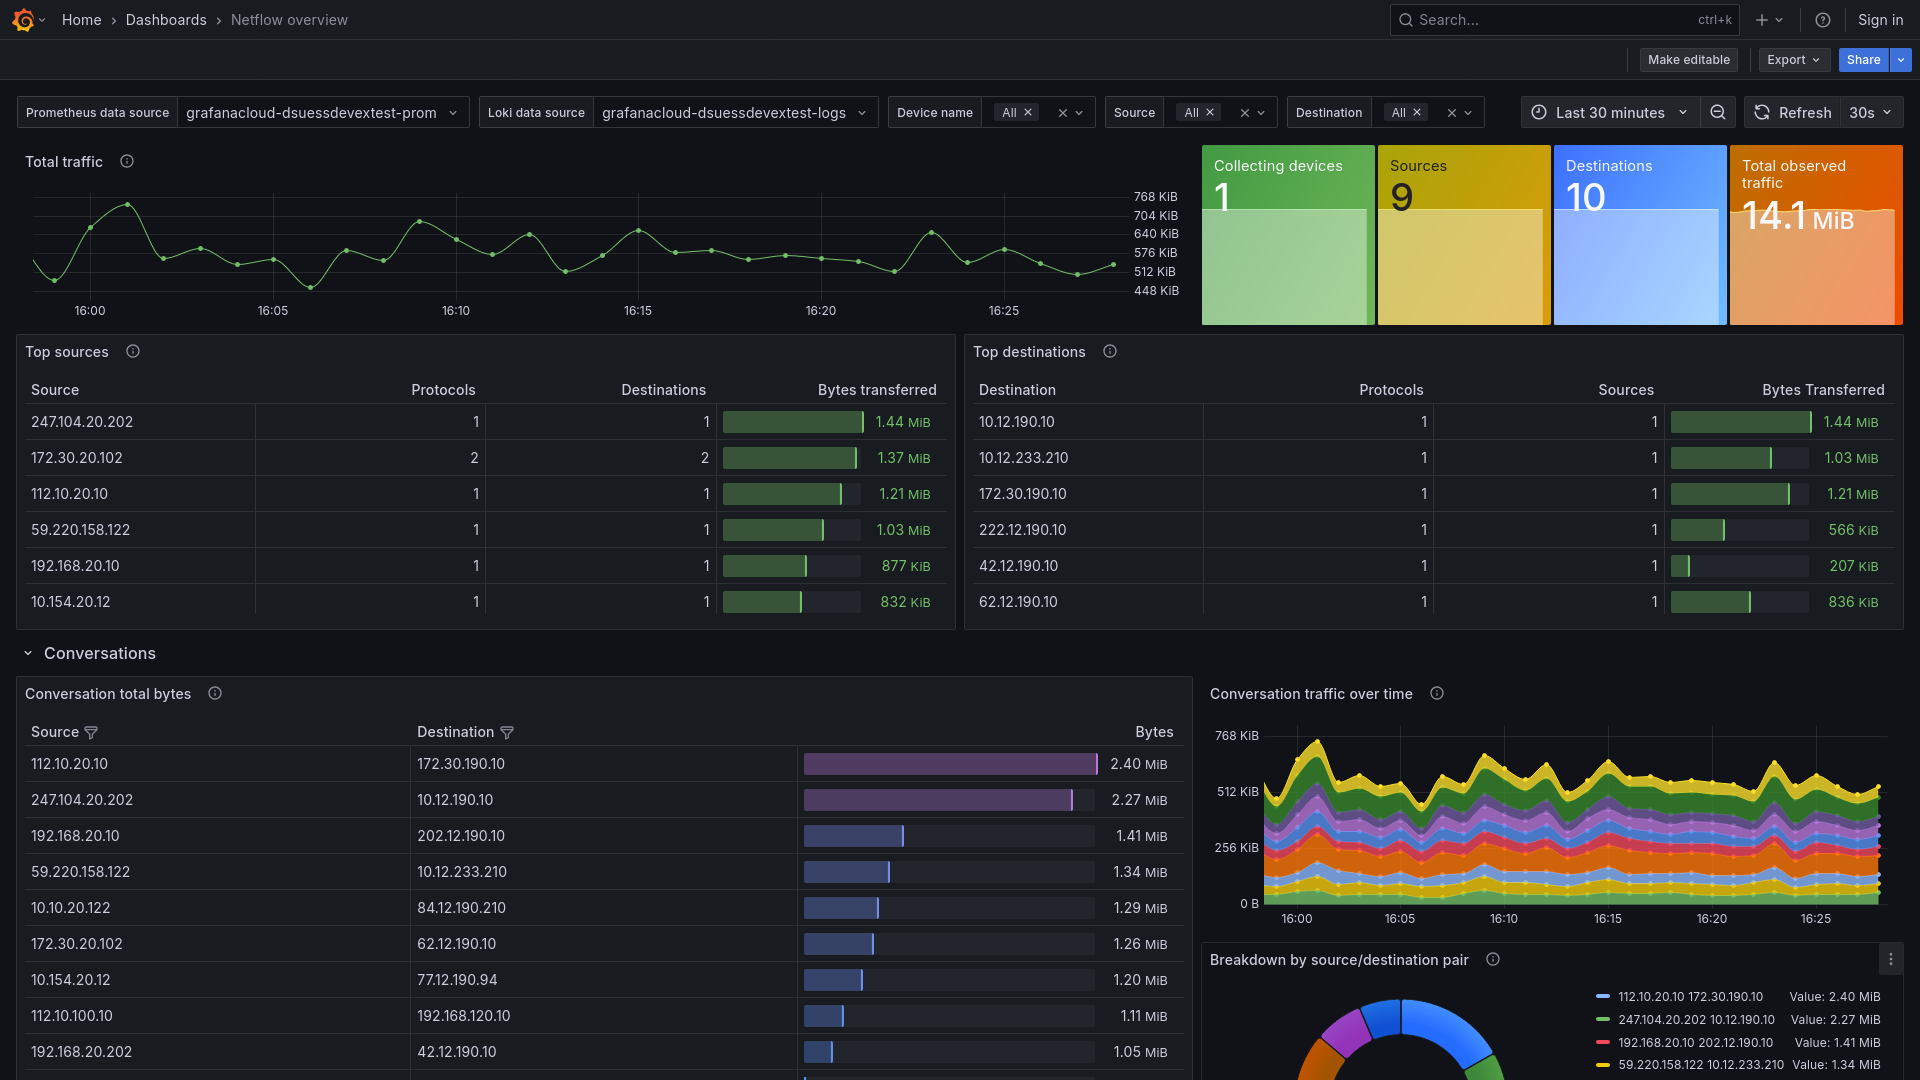
- Netflow overview
Netflow Overview
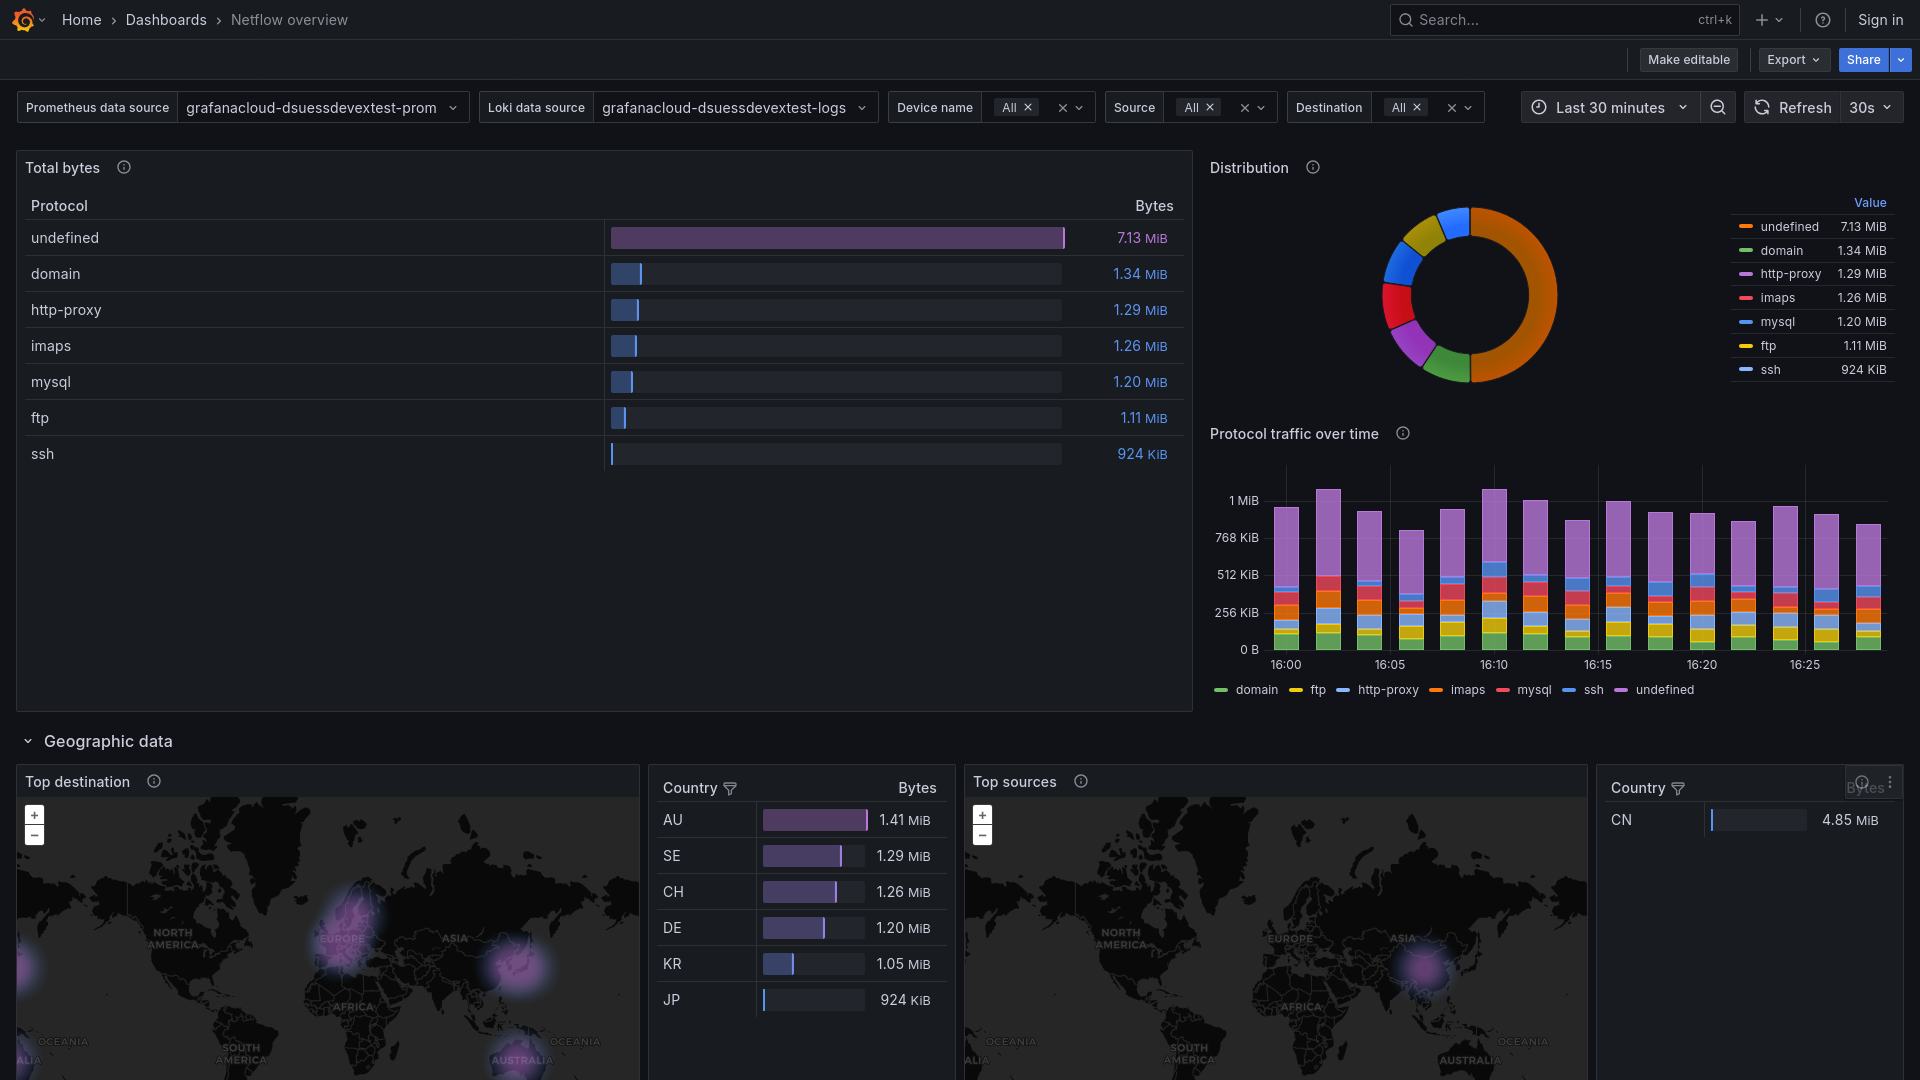
Netflow Overview, Part 2
Metrics
The most important metrics provided by the Netflow integration, which are used on the pre-built dashboard, are as follows:
- network_io_by_flow_bytes
- up
Changelog
# 1.0.0 - July 2025

* Initial release using ktranslate to generate metrics from Netflow/IPFIX/sFlow
Cost
By connecting your Netflow instance to Grafana Cloud, you might incur charges. To view information on the number of active series that your Grafana Cloud account uses for metrics included in each Cloud tier, see Active series and dpm usage and Cloud tier pricing.


