Databricks integration for Grafana Cloud
Databricks is a unified analytics platform for data engineering, data science, and machine learning workloads. It provides a lakehouse architecture combining the best of data warehouses and data lakes.
The Databricks integration uses Grafana Alloy to collect billing, jobs, pipelines, and SQL warehouse metrics from Databricks System Tables. Accompanying dashboards are provided to visualize these metrics.
This integration supports providing the metrics listed in the docs via the Databricks exporter, which is integrated into Grafana Alloy.
This integration includes 16 useful alerts and 3 pre-built dashboards to help monitor and visualize Databricks metrics.
Before you begin
Before configuring Alloy to collect Databricks metrics, you need:
- Databricks Workspace with Unity Catalog and System Tables enabled
- Service Principal with OAuth2 M2M authentication configured
- SQL Warehouse for querying System Tables (serverless is recommended for cost efficiency)
Get your workspace hostname:
- Copy your workspace URL subdomain, for example,
dbc-abc123-def456.cloud.databricks.com.
Create a SQL Warehouse:
- Go to SQL Warehouses in the sidebar and click Create SQL warehouse.
- Configure the warehouse:
- Size: 2X-Small (minimum size to reduce costs).
- Auto stop: After 10 minutes of inactivity.
- Scaling: Min 1, Max 1 cluster.
- Click Create, then go to the Connection Details tab.
- Copy the HTTP path, for example,
/sql/1.0/warehouses/abc123def456.
Create a Service Principal:
- Click your workspace name (top-right) and select Manage Account.
- Go to User Management > Service Principals tab > Add service principal.
- Enter a name, for example,
grafana-cloud-integration. - Go to Credentials & secrets tab > OAuth secrets > Generate secret.
- Select the maximum lifetime (730 days) and click Generate.
- Copy the Client ID and Client Secret. You will need both for the integration configuration.
Assign the Service Principal to your workspace:
- Go to Workspaces in the sidebar and select your workspace.
- Go to the Permissions tab and click Add permissions.
- Search for the Service Principal and assign it the Admin permission.
Grant SQL permissions to the Service Principal:
As a metastore admin or user with MANAGE privilege, run the following SQL statements in a query editor:
GRANT USE CATALOG ON CATALOG system TO `<service-principal-client-id>`;
GRANT USE SCHEMA ON SCHEMA system.billing TO `<service-principal-client-id>`;
GRANT SELECT ON SCHEMA system.billing TO `<service-principal-client-id>`;
GRANT USE SCHEMA ON SCHEMA system.query TO `<service-principal-client-id>`;
GRANT SELECT ON SCHEMA system.query TO `<service-principal-client-id>`;
GRANT USE SCHEMA ON SCHEMA system.lakeflow TO `<service-principal-client-id>`;
GRANT SELECT ON SCHEMA system.lakeflow TO `<service-principal-client-id>`;
Replace <service-principal-client-id> with your Service Principal’s Client ID.
Refer to the Databricks documentation for detailed OAuth2 M2M setup instructions.
Install Databricks integration for Grafana Cloud
- In your Grafana Cloud stack, click Connections in the left-hand menu.
- Find Databricks and click its tile to open the integration.
- Review the prerequisites in the Configuration Details tab and set up Grafana Alloy to send Databricks metrics to your Grafana Cloud instance.
- Click Install to add this integration’s pre-built dashboards and alerts to your Grafana Cloud instance, and you can start monitoring your Databricks setup.
Configuration snippets for Grafana Alloy
Simple mode
Replace the following:
<your-server-hostname>: The Databricks workspace hostname, for example,dbc-abc123-def456.cloud.databricks.com.<your-warehouse-http-path>: The HTTP path of the SQL Warehouse, for example,/sql/1.0/warehouses/abc123def456.<your-service-principal-client-id>: The OAuth2 Application ID or Client ID of your Service Principal.<your-service-principal-client-secret>: The OAuth2 Client Secret of your Service Principal.
Integrations snippets
prometheus.exporter.databricks "integrations_databricks" {
	server_hostname    = "<your-databricks-server-hostname>"
	warehouse_http_path = "<your-databricks-warehouse-http-path>"
	client_id          = "<your-databricks-client-id>"
	client_secret      = "<your-databricks-client-secret>"
}

discovery.relabel "integrations_databricks" {
	targets = prometheus.exporter.databricks.integrations_databricks.targets

	rule {
		target_label = "instance"
		replacement  = constants.hostname
	}

	rule {
		target_label = "job"
		replacement  = "integrations/databricks"
	}
}

prometheus.scrape "integrations_databricks" {
	targets         = discovery.relabel.integrations_databricks.output
	forward_to      = [prometheus.remote_write.metrics_service.receiver]
	job_name        = "integrations/databricks"
	scrape_interval = "10m0s"
	scrape_timeout  = "9m0s"
}
Advanced mode
Replace the following:
<your-server-hostname>: The Databricks workspace hostname, for example,dbc-abc123-def456.cloud.databricks.com.<your-warehouse-http-path>: The HTTP path of the SQL Warehouse, for example,/sql/1.0/warehouses/abc123def456.<your-service-principal-client-id>: The OAuth2 Application ID or Client ID of your Service Principal.<your-service-principal-client-secret>: The OAuth2 Client Secret of your Service Principal.
Advanced integrations snippets
prometheus.exporter.databricks "integrations_databricks" {
	server_hostname    = "<your-databricks-server-hostname>"
	warehouse_http_path = "<your-databricks-warehouse-http-path>"
	client_id          = "<your-databricks-client-id>"
	client_secret      = "<your-databricks-client-secret>"
}

discovery.relabel "integrations_databricks" {
	targets = prometheus.exporter.databricks.integrations_databricks.targets

	rule {
		target_label = "instance"
		replacement  = constants.hostname
	}

	rule {
		target_label = "job"
		replacement  = "integrations/databricks"
	}
}

prometheus.scrape "integrations_databricks" {
	targets         = discovery.relabel.integrations_databricks.output
	forward_to      = [prometheus.remote_write.metrics_service.receiver]
	job_name        = "integrations/databricks"
	scrape_interval = "10m0s"
	scrape_timeout  = "9m0s"
}
The Databricks integration uses Alloy’s embedded exporter to query Databricks System Tables.
Optional configuration arguments:
Lookback windows:
The exporter queries Databricks System Tables using SQL with sliding time windows. Each scrape collects data from now - lookback to now:
billing_lookback: Queriessystem.billing.usagefor DBU consumption and cost estimates. Databricks billing data typically has 24-48 hour lag.jobs_lookback: Queriessystem.lakeflow.job_run_timelinefor job run counts, durations, and status.pipelines_lookback: Queriessystem.lakeflow.pipeline_event_logfor DLT pipeline metrics.queries_lookback: Queriessystem.query.historyfor SQL warehouse query metrics.
The lookback window should be at least 2x the scrape_interval to ensure data continuity between scrapes. For example, with a 10-minute scrape interval, use at least 20 minutes of lookback.
Tuning recommendations:
scrape_interval: Use 10-30 minutes. The exporter queries Databricks System Tables which can be slow. Increase thescrape_intervalto reduce your SQL Warehouse costs.scrape_timeout: Must be less thanscrape_interval. The exporter typically takes 90-120 seconds per scrape depending on data volume.- Lookback vs interval: The lookback windows should be at least 2x the scrape interval. The defaults (
3hfor jobs and pipelines,2hfor queries) work well with 10-30 minute scrape intervals.
High cardinality warning:
The collect_task_retries flag adds task-level retry metrics which can significantly increase cardinality for workspaces with many jobs. Only enable this feature if you really need it.
Dashboards
The Databricks integration installs the following dashboards in your Grafana Cloud instance to help monitor your system.
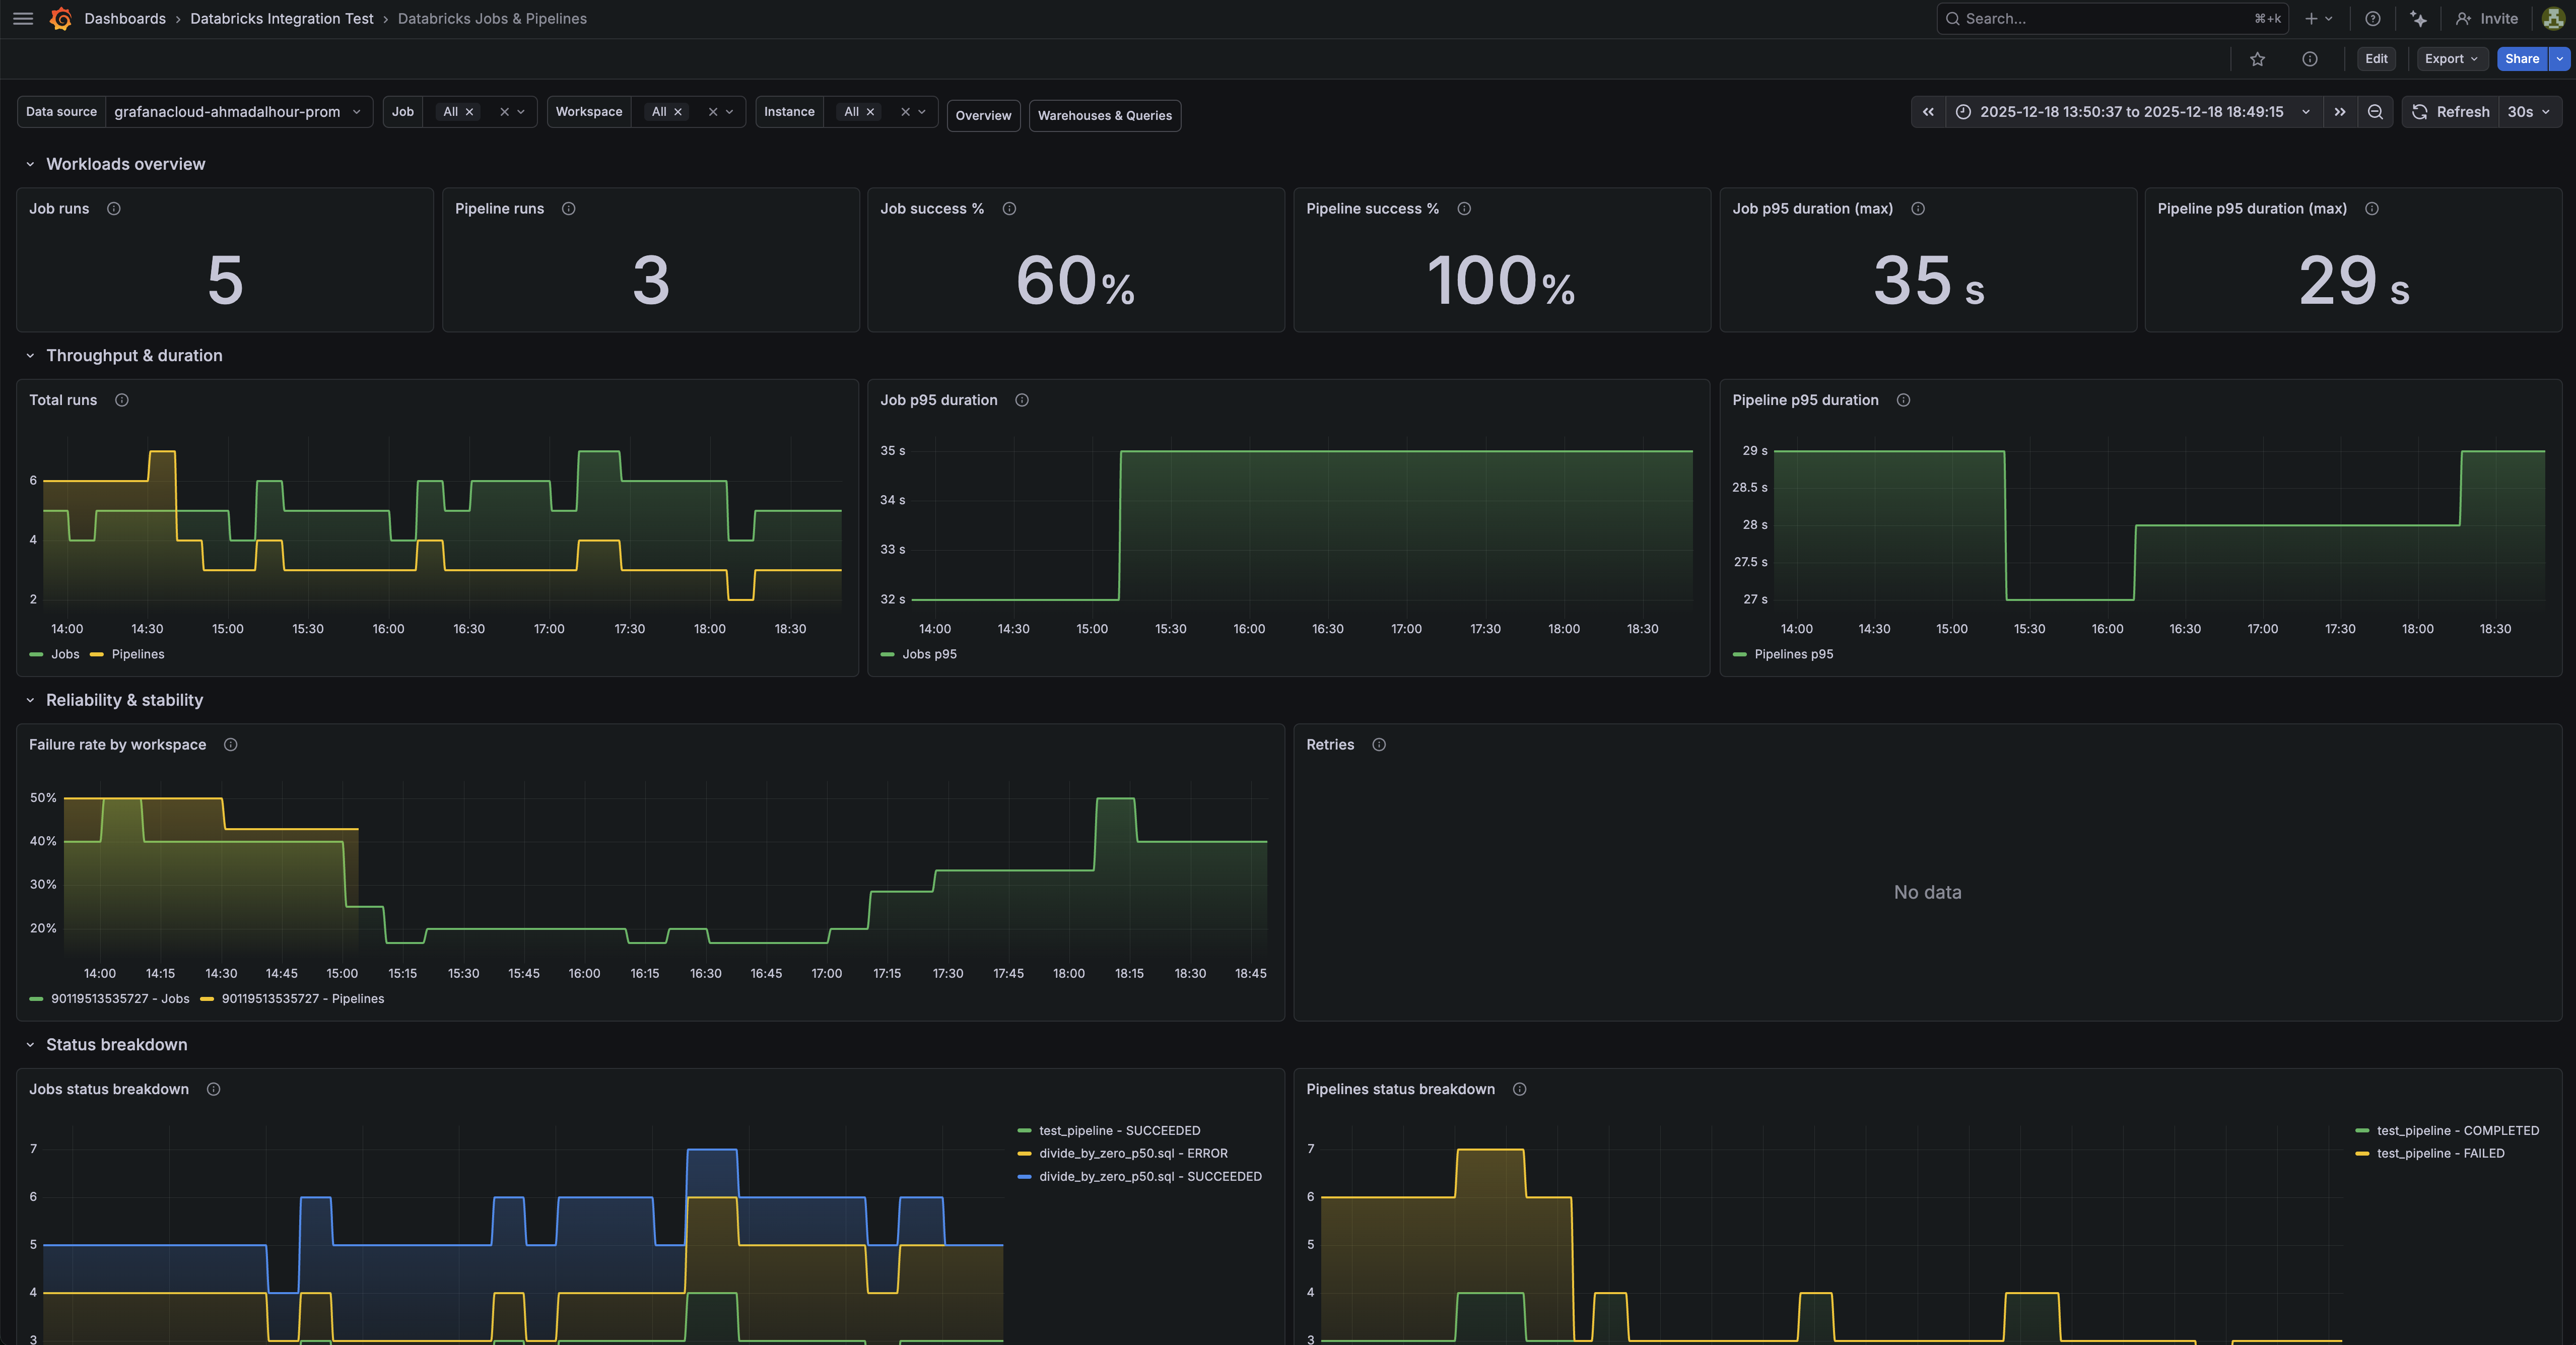
- Databricks Jobs & Pipelines
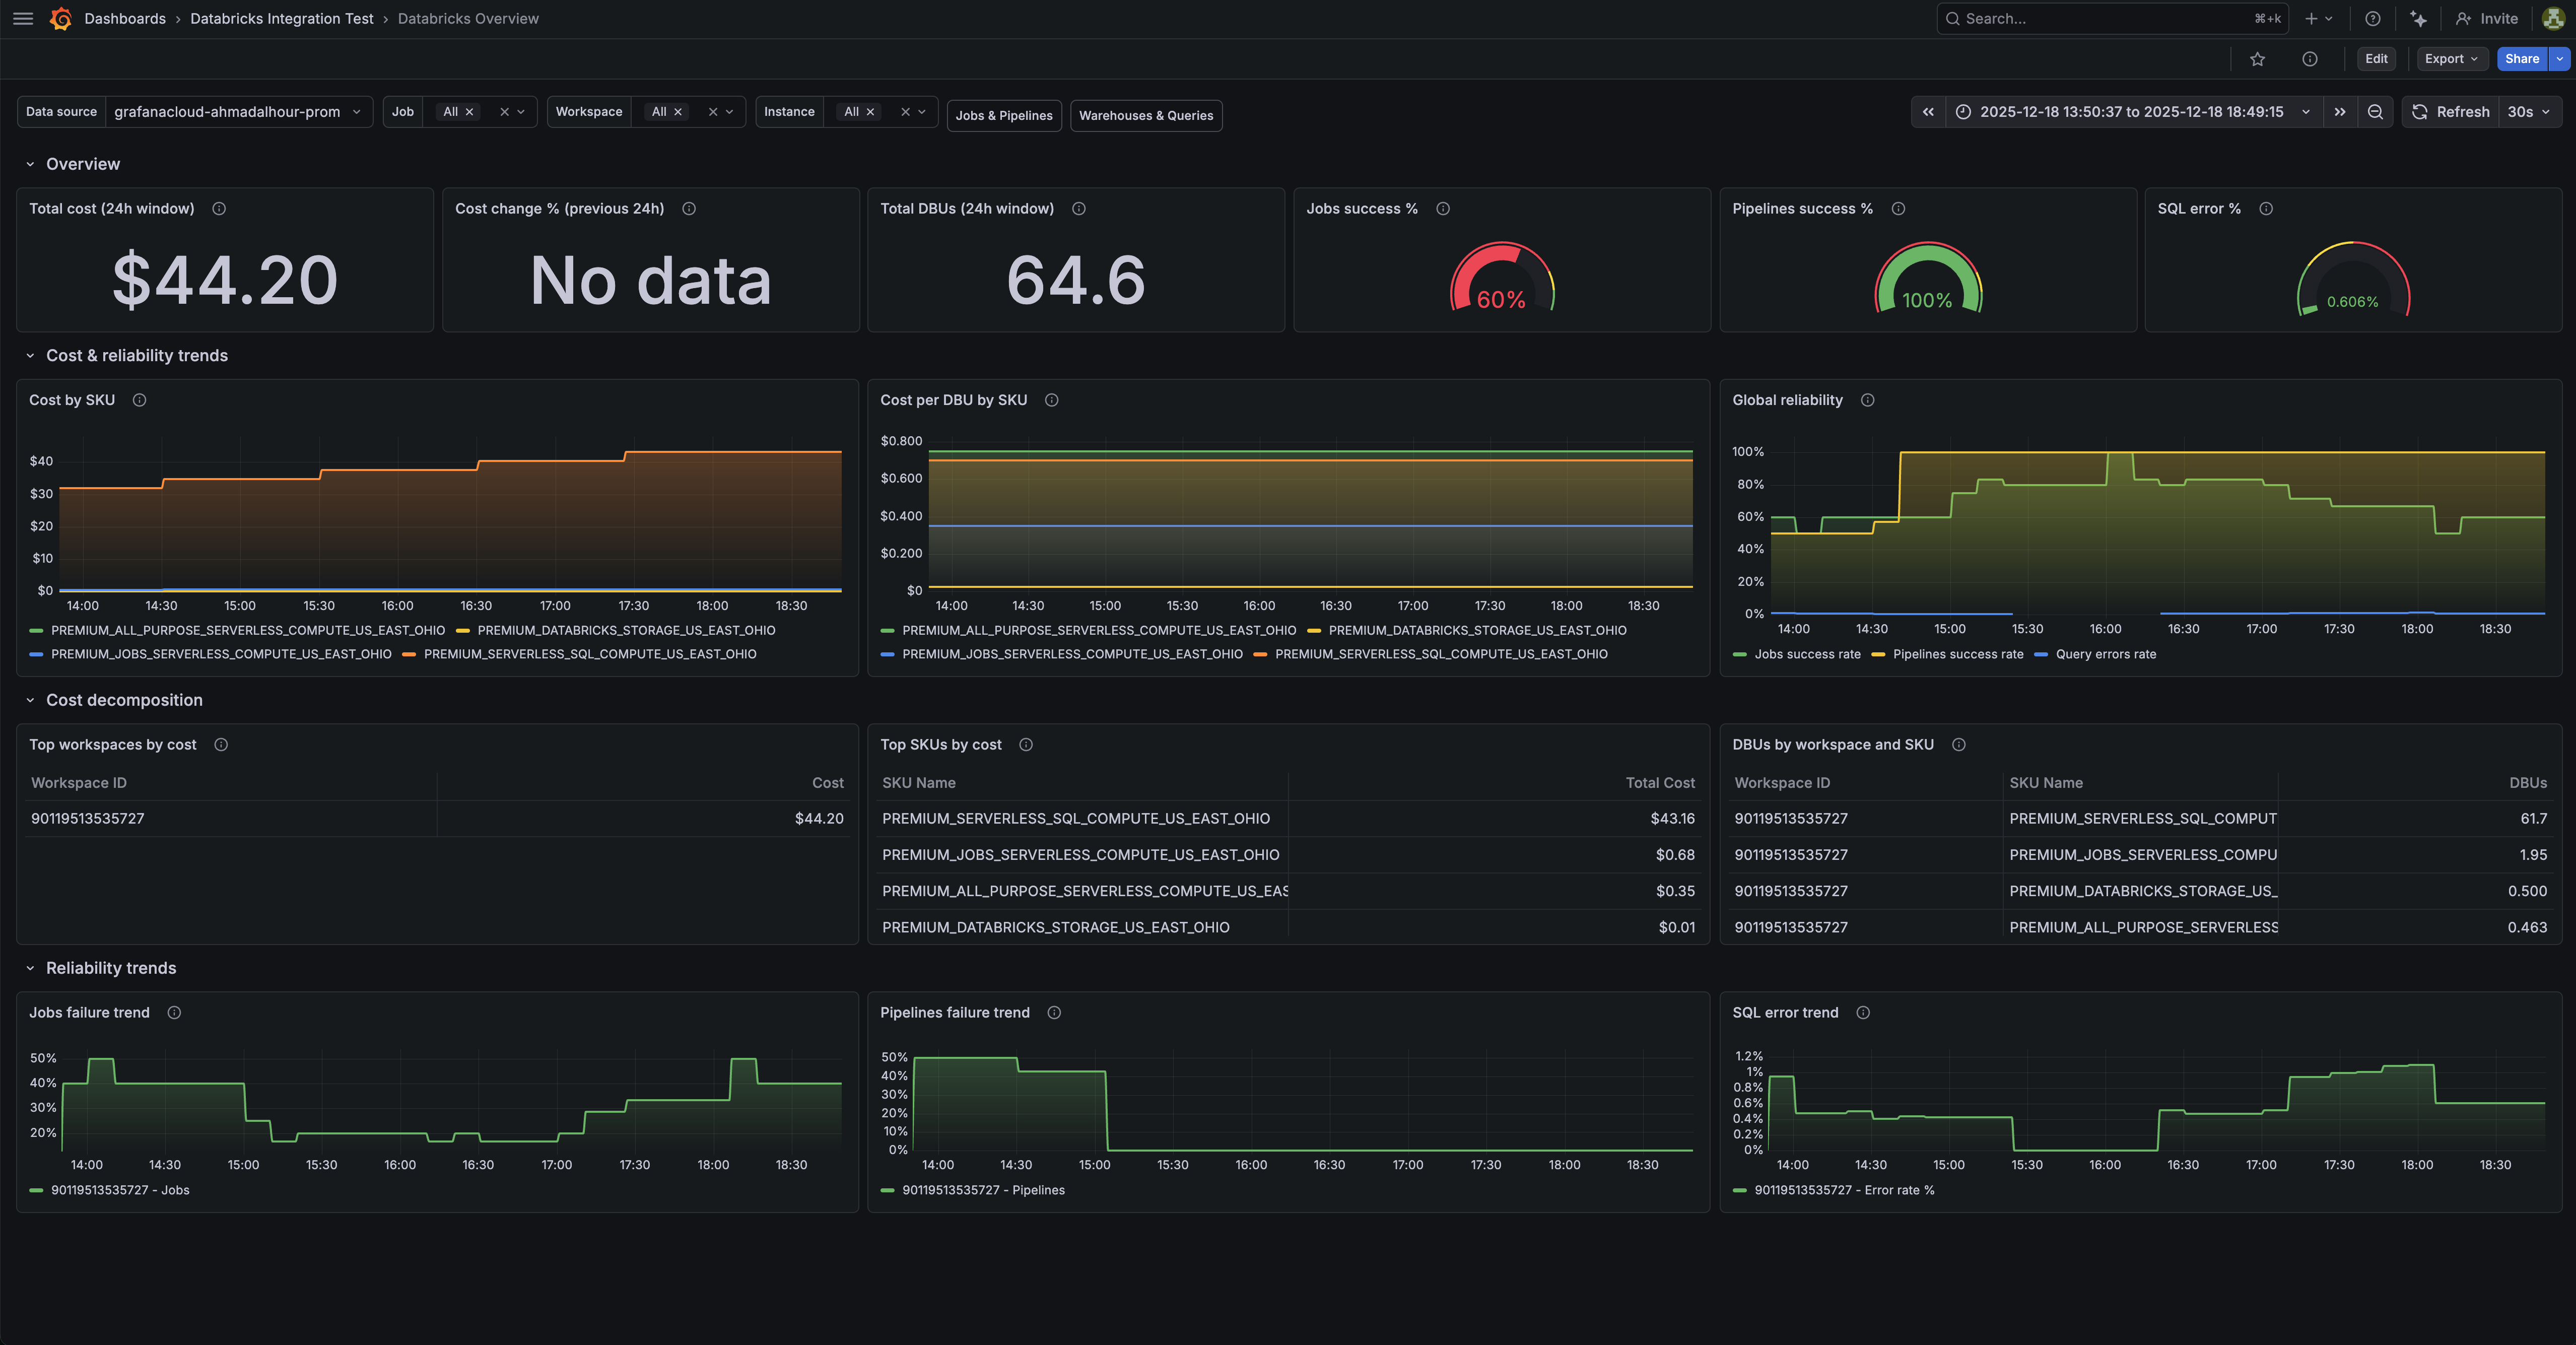
- Databricks Overview
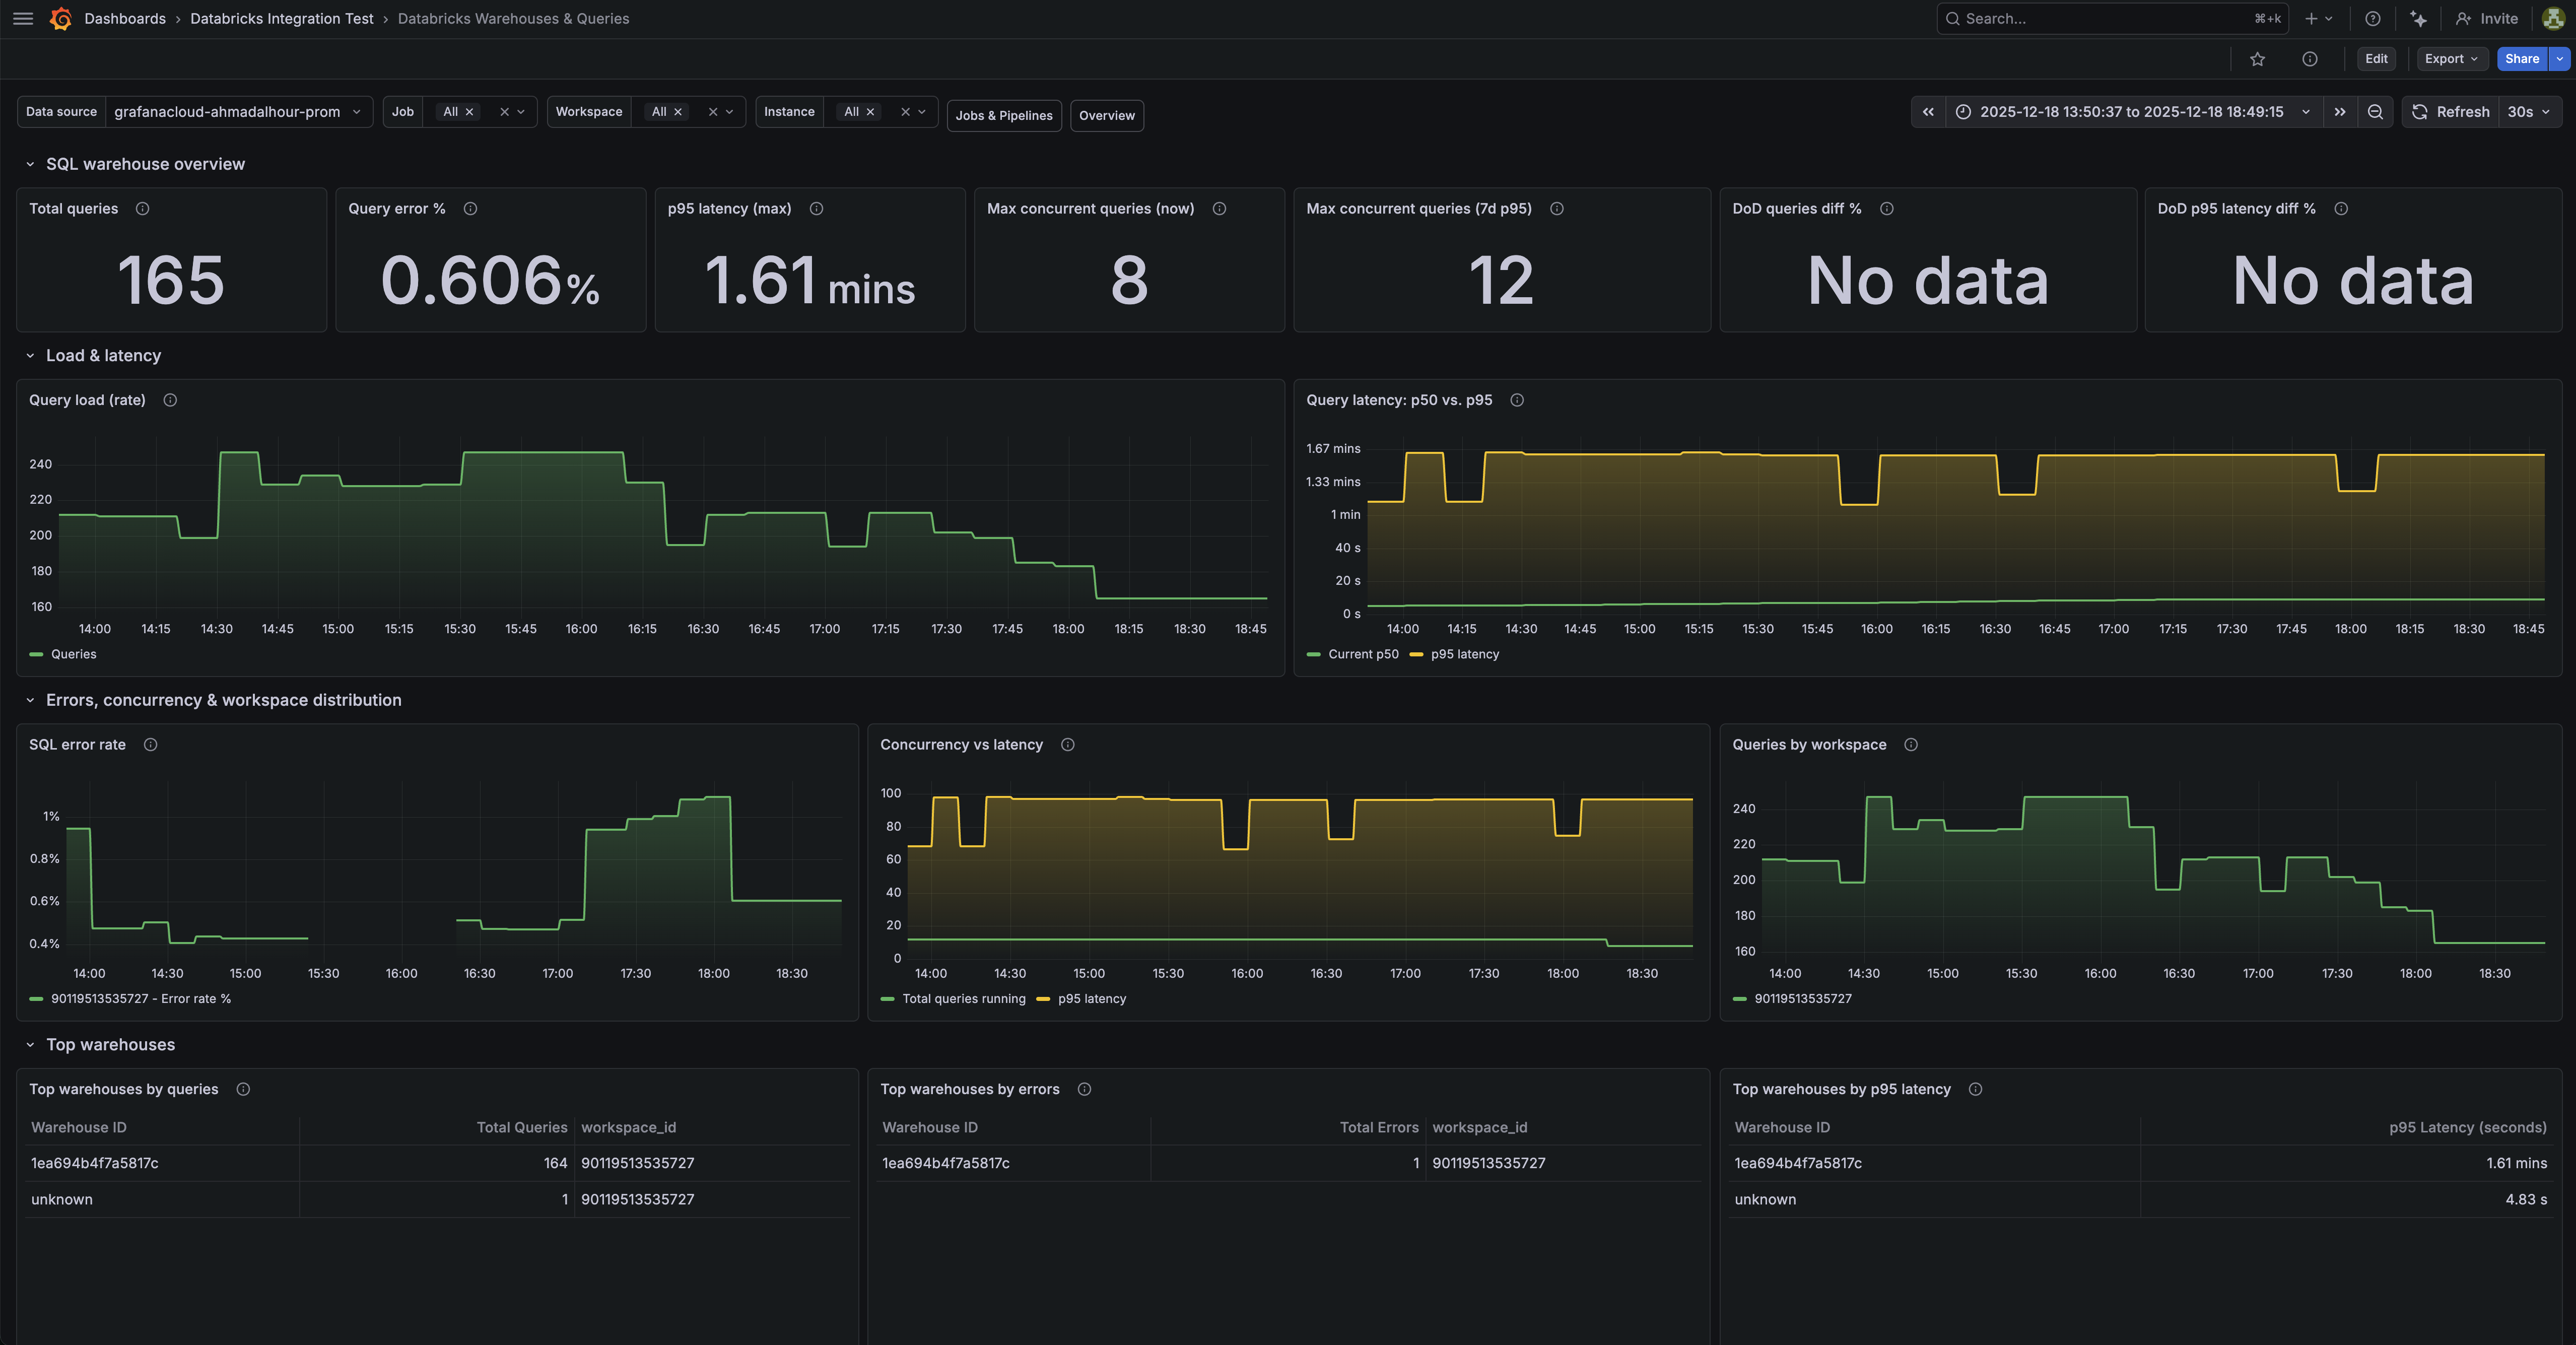
- Databricks Warehouses & Queries
Databricks overview dashboard.
Databricks warehouses and queries dashboard (1/2).
Databricks jobs and pipelines dashboard (1/3).
Alerts
The Databricks integration includes the following useful alerts:
Metrics
The most important metrics provided by the Databricks integration, which are used on the pre-built dashboards and Prometheus alerts, are as follows:
- databricks_billing_cost_estimate_usd_sliding
- databricks_billing_dbus_sliding
- databricks_job_run_duration_seconds_sliding
- databricks_job_run_status_sliding
- databricks_job_runs_sliding
- databricks_pipeline_freshness_lag_seconds_sliding
- databricks_pipeline_retry_events_sliding
- databricks_pipeline_run_duration_seconds_sliding
- databricks_pipeline_run_status_sliding
- databricks_pipeline_runs_sliding
- databricks_queries_running_sliding
- databricks_queries_sliding
- databricks_query_duration_seconds_sliding
- databricks_query_errors_sliding
- databricks_task_retries_sliding
- up
Changelog
# 1.0.1 - February 2026

- Fix metric_names and regex snippet in alloy example config

# 1.0.0 - February 2026

- Initial release
Cost
By connecting your Databricks instance to Grafana Cloud, you might incur charges. To view information on the number of active series that your Grafana Cloud account uses for metrics included in each Cloud tier, see Active series and dpm usage and Cloud tier pricing.


