
Get started with monitoring using an integration
Install an integration to connect your data and start monitoring with Grafana in just a few steps. This enables you to begin viewing metrics and logs for your operating system, server, or service quickly. This section walks through installing and configuring an operating system integration and viewing the system metrics on a prebuilt dashboard.
The installation steps Grafana Cloud provides are tailored to the integration. This procedure shows a Linux server integration, but you can install the MacOS or Windows integrations similarly. Integrations use a collector (Grafana Alloy) to collect metrics for the operating system running on a node, including CPU usage, load average, memory usage, and disk and networking I/O. The collector can also scrape logs using Promtail.
Before you begin
Before you begin installing an integration, ensure you have:
- A Grafana Cloud account. To create an account, see Grafana Cloud.
- A machine running Linux (or the OS of the integration you’re installing).
- Command line (terminal) access to the machine.
- Admin access to the machine on which you are installing the integration.
- Configured your firewall to allow outbound HTTPS (port 443) to
*.grafana.net.
For more information about creating a Grafana Cloud account, refer to Sign up for a Grafana Cloud account.
Install the integration
- In your Grafana Cloud stack, click Connections in the main menu.
- Search for the name of the operating system, server, or service to be monitored in the list of integrations to filter the list.
- Click the tile for your integration.
- Follow the instructions on the Configuration details tab.
If you decide later to stop using the integration, you can remove the installed integration.
To uninstall Alloy, refer to the overview of install Grafana Alloy and choose the platform you installed Alloy on to find the instructions for removing Alloy.
Configuration options
This section describes configuration options you can use when you install the collector.
Hostname value
In the Hostname Value text box, you can enter a label to replace the default instance label used in the collector’s configuration snippets.
This label is necessary to identify a specific node in your System Under Observation on Integration dashboards, alerts, and rules.
This value is required for most features.
Use this feature to ensure the replacement is done correctly before pasting it to your Alloy configuration file.
Advanced integration
Your system generates a large amount of metrics, but only a subset is utilized by the integrations. The Advanced integration toggle gives you the option to either send all of the metrics to Grafana Cloud or filter and send only the subset that’s necessary for the integration dashboards, alerts, and rules.
This feature allows you to save money by sending only the metrics you need. However, if you want to monitor additional metrics that aren’t included in the integration, simply toggle the option to receive the full set of metrics.
To see the subset of metrics that will be included:
- Click How to choose either reduced or full set of metrics.
- Click List of default metrics.
View a preconfigured dashboard
After the collector starts collecting data, you can view the data on a preconfigured dashboard.
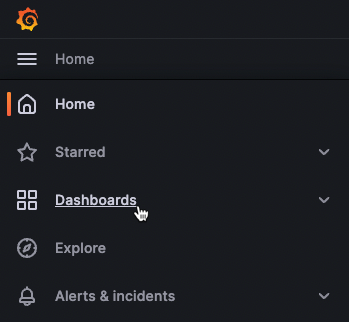
In your Grafana stack, click Dashboards in the main menu.
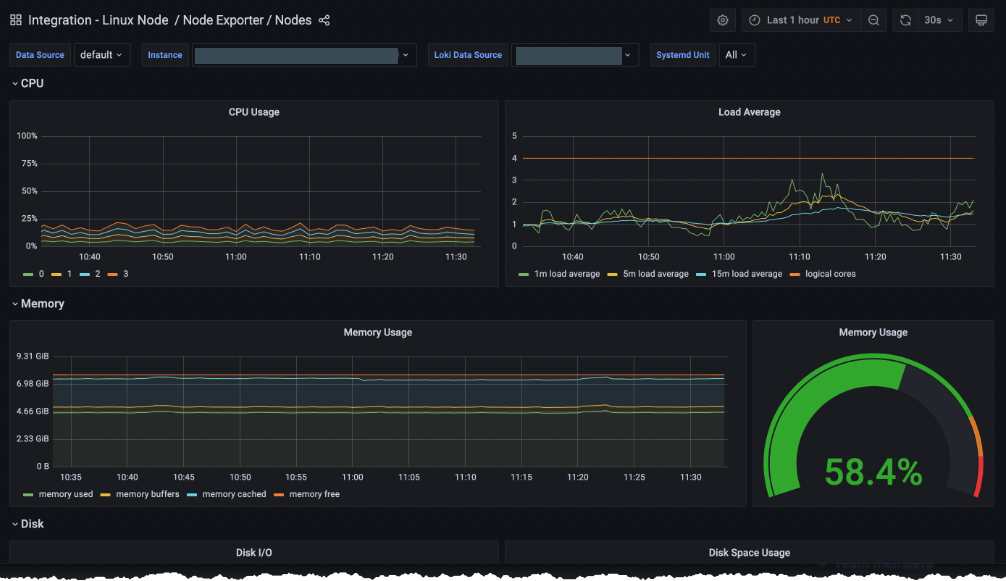
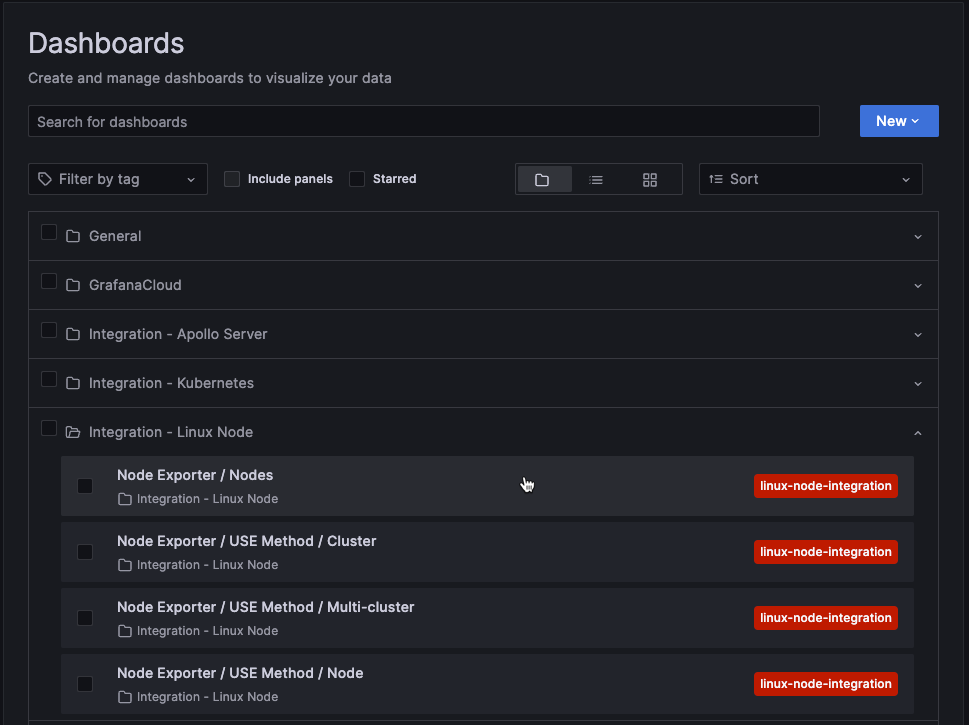
On the Dashboards page, locate and select a preconfigured dashboard. The Linux server dashboard is called Nodes and is found in the Linux Node folder. Click it to open the dashboard.
The dashboard is initially empty until the first scrape, which depends on the scrape interval (the amount of time between each scrape of the endpoint). Grafana Cloud provides a default scrape interval for each integration that displays on the configuration page. You can refine your collector settings, including the scrape interval.
After the collector runs for a while, more data displays:
![Linux integration dashboard]()
To view the dashboard at a later time, click Dashboards and search or browse to locate the integration.
![Select Dashboard]()
Click the integration, for this example, Integration - Linux Node to display recent data.
![Node Exporter / MacOS dashboard]()
Next steps
Grafana Cloud provides many integrations for you to choose from. Refer to the Integrations reference for the full list.
To learn ways to configure the data you are collecting, refer to the Configure Grafana Alloy documentation.


