View and analyze profiling data
There are three main views to visualize and analyze profiling data in Grafana:
- Grafana Profiles Drilldown app
- Explore view
- Dashboards view
In addition, you can use Flame graph AI to assist with interpreting flame graphs.
Profiles Drilldown app
Profiles Drilldown is a native Grafana application designed to integrate seamlessly with Pyroscope, the open source continuous profiling platform, providing a smooth, queryless experience for browsing and analyzing profiling data.
You can use Profiles Drilldown in Grafana Cloud or in your own Grafana instance.
For more information, refer to Access or install Profiles Drilldown.
To access this view, navigate to Drilldown > Profiles in the sidebar menu.

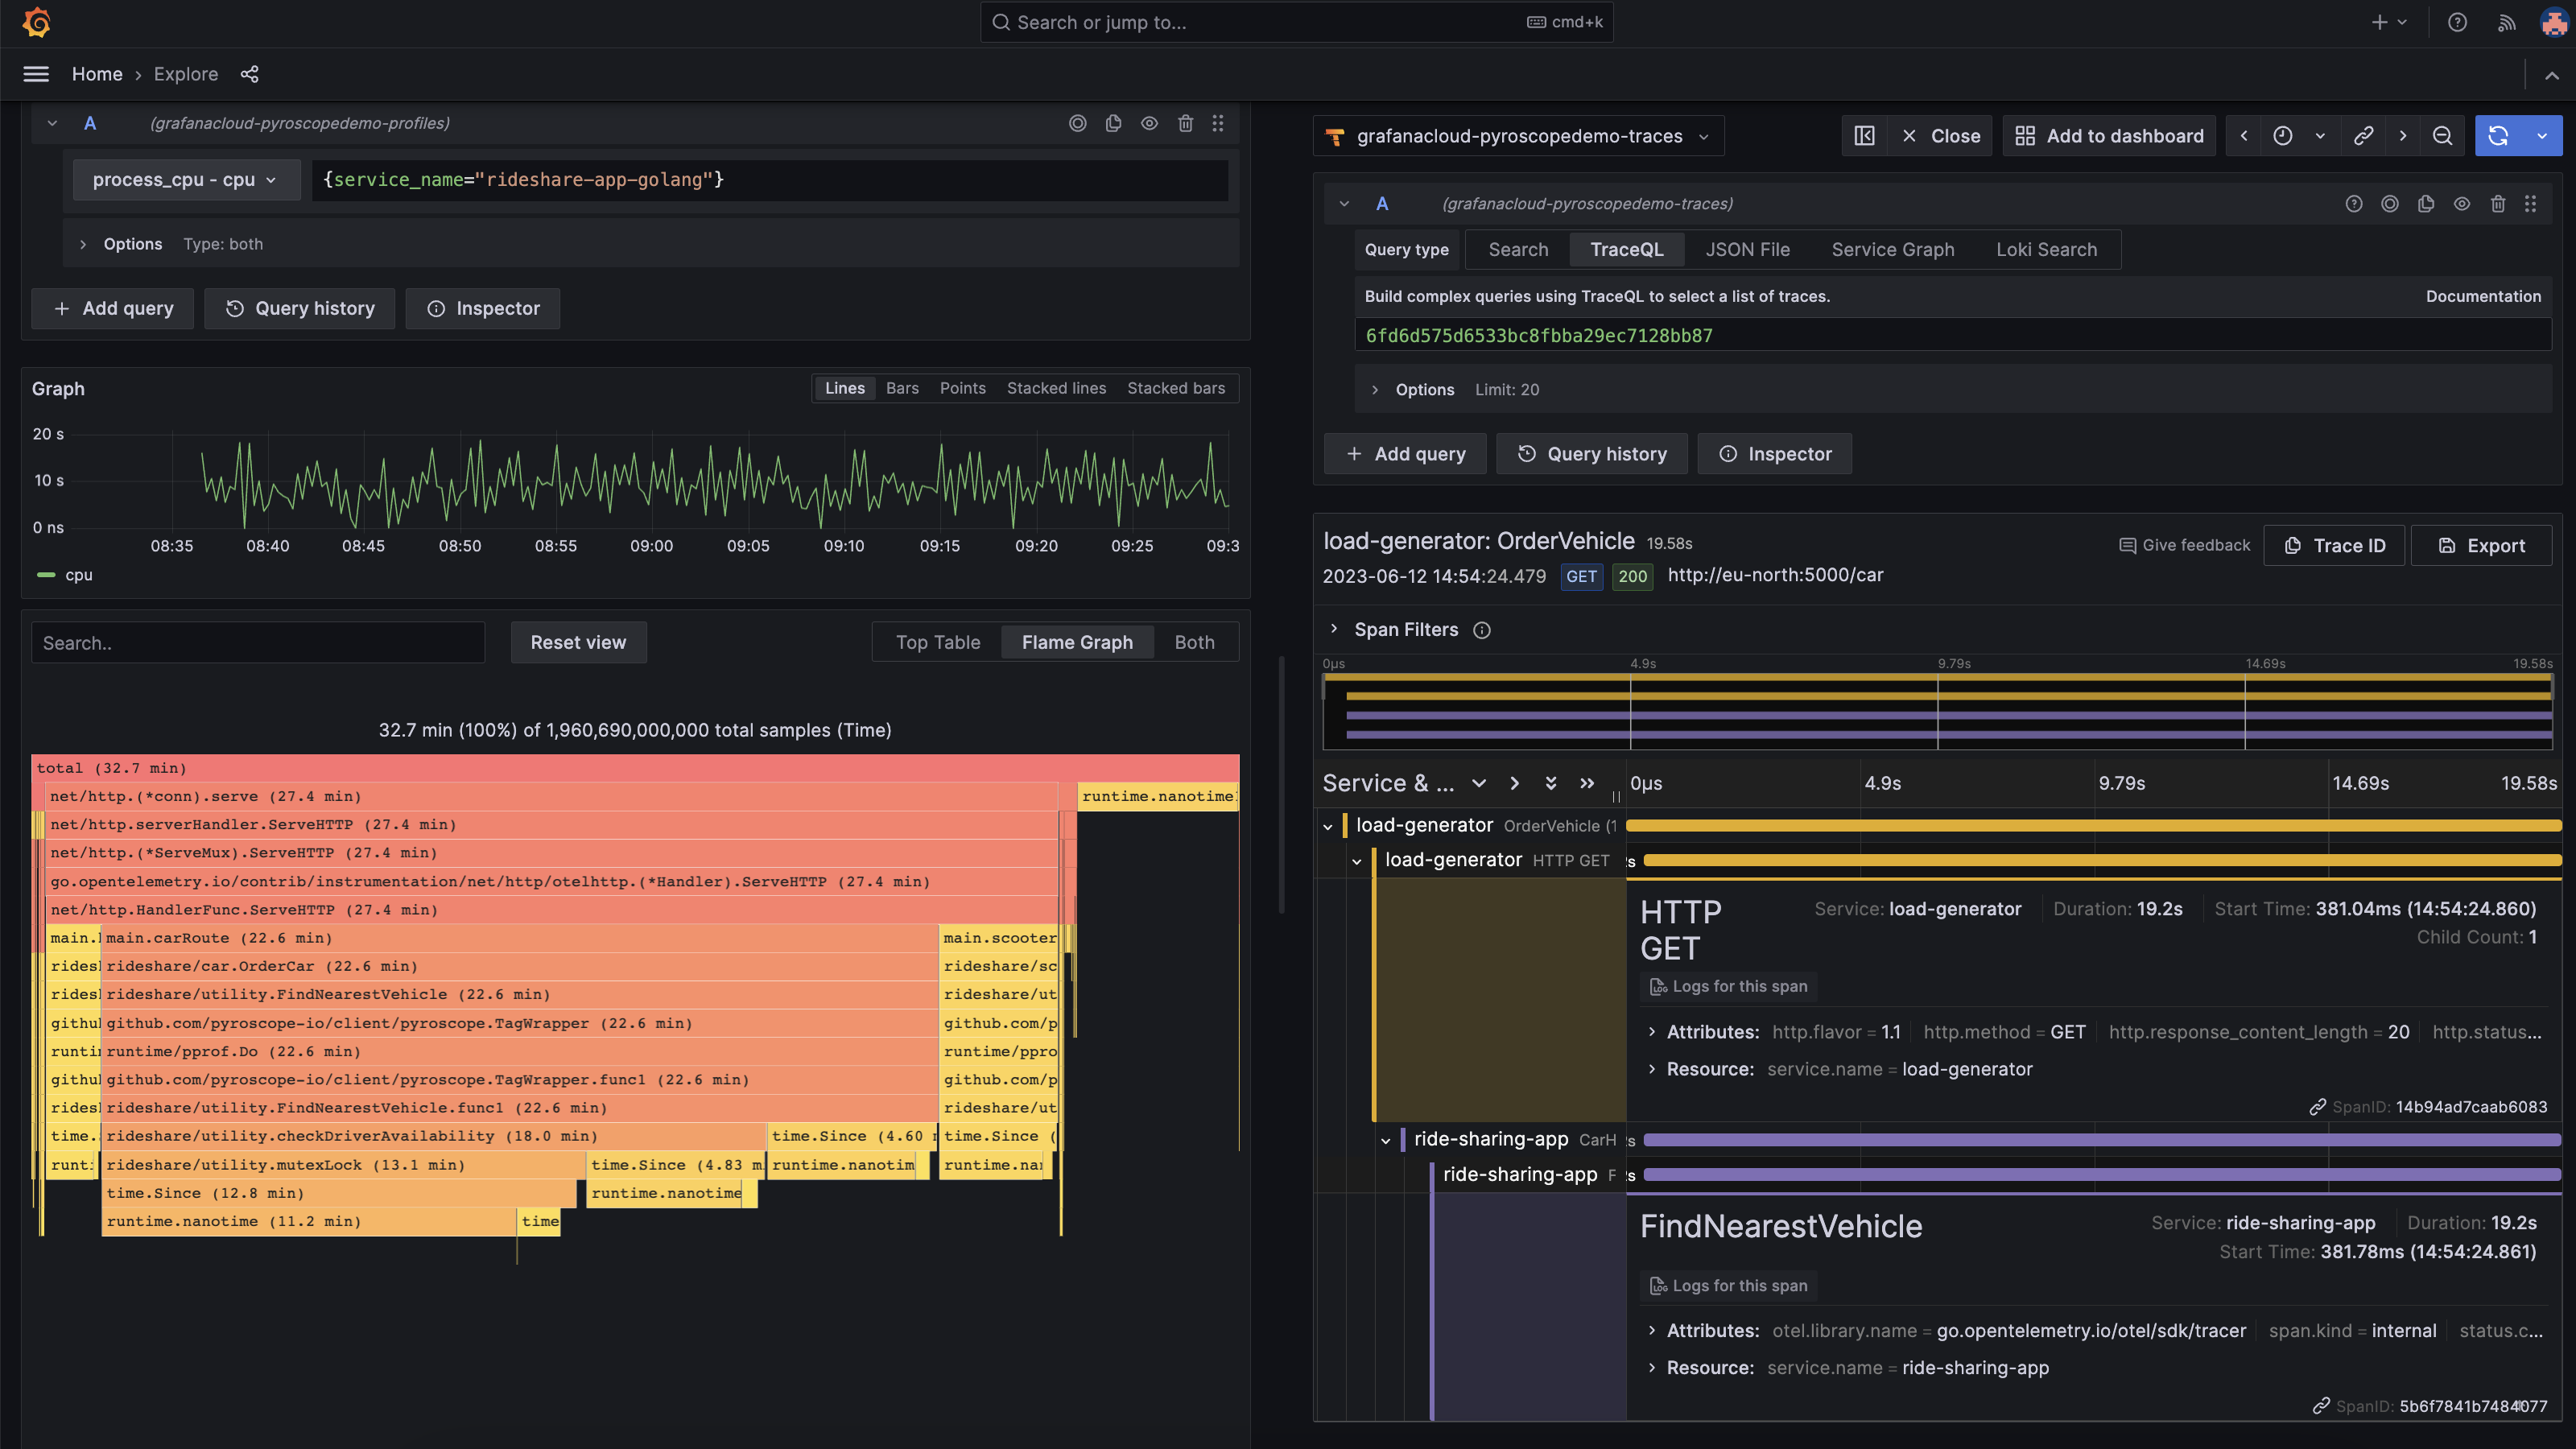
Explore view
The Explore view lets you create targeted queries to your profiling data or view your profiling data alongside matching logs, metrics, traces, K6 test results, or any other data that can be queried in Explore.

To access this view, click Drilldown > Profiles in the sidebar menu.
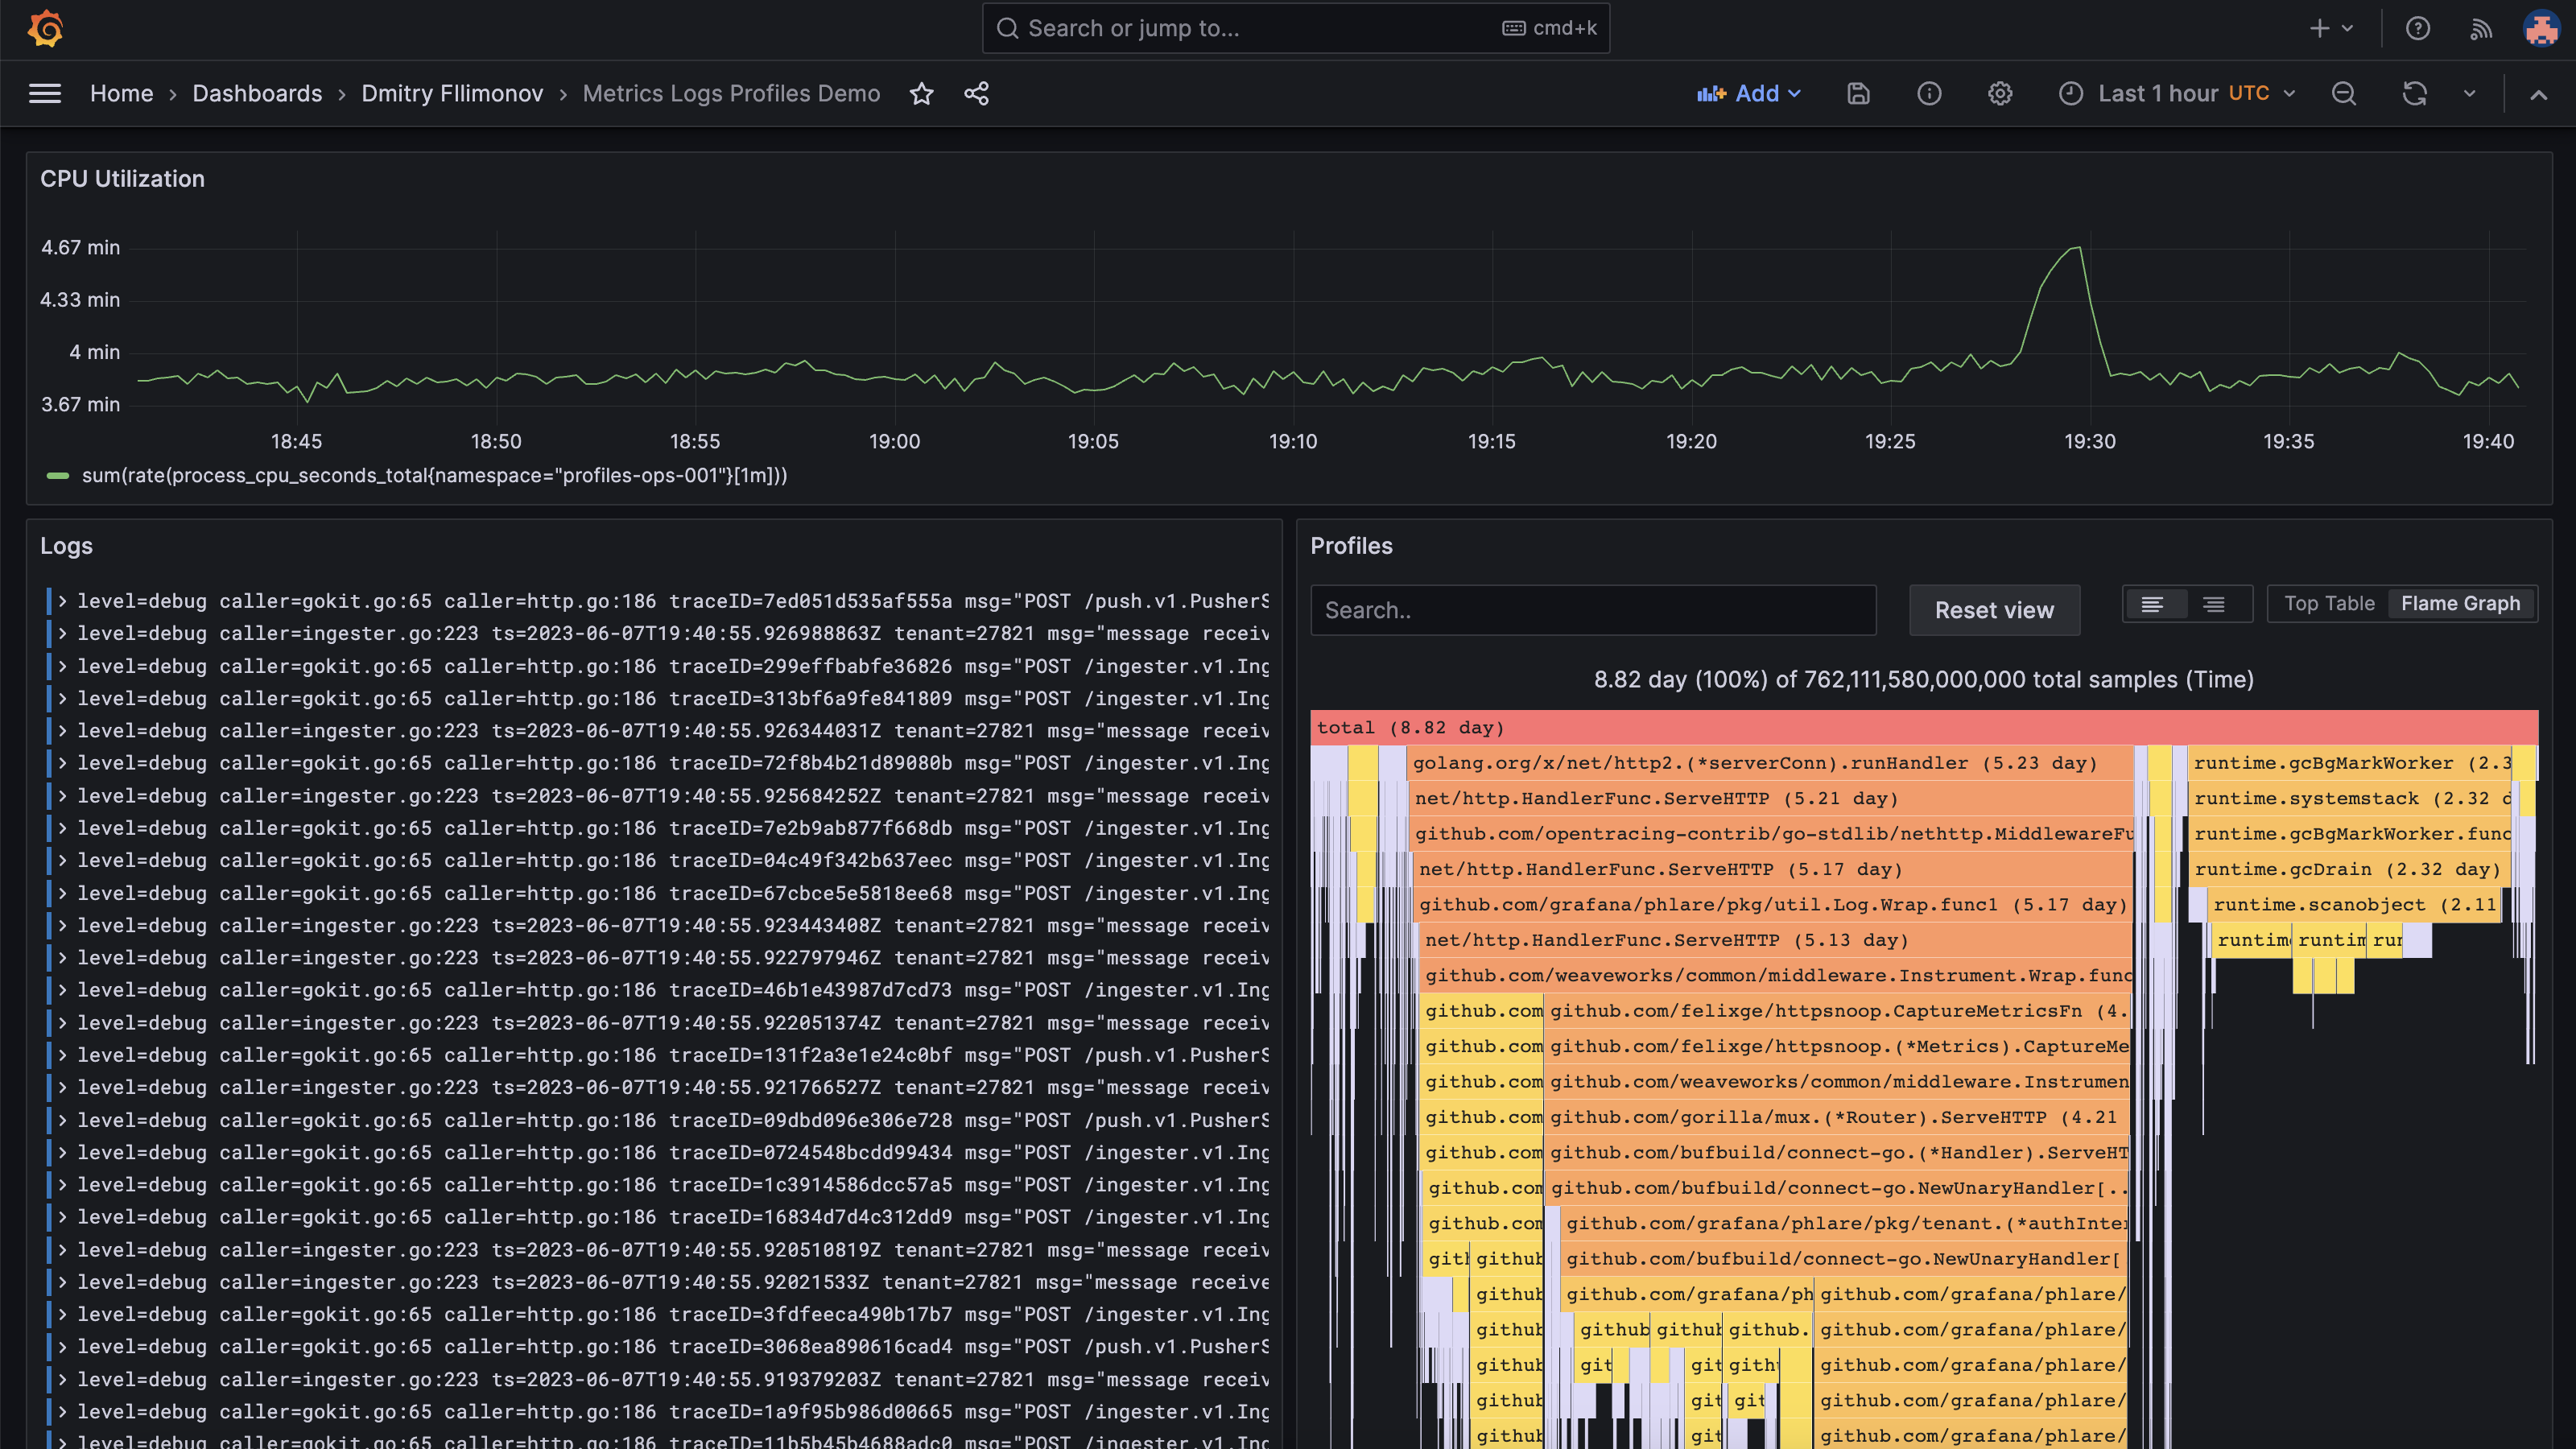
Dashboard view
The Dashboards view gives you a real-time understanding of what your application is doing and is customizable to help you gain a comprehensive understanding of your application’s performance and identify areas for optimization.

To access this view, click Dashboards in the sidebar menu.


