Menu
Documentation Grafana Cloud
Monitor applications
Frontend Observability
Visualize and explore data
Application errors
Grafana Cloud
Monitor applications
Frontend Observability
Visualize and explore data
Application errors
Grafana Cloud
Application errors overview
The Errors Overview page helps you identify, prioritize, and troubleshoot errors in your frontend application. Use this page to understand which errors are affecting the most users, which URLs are problematic, and which browsers are experiencing issues.
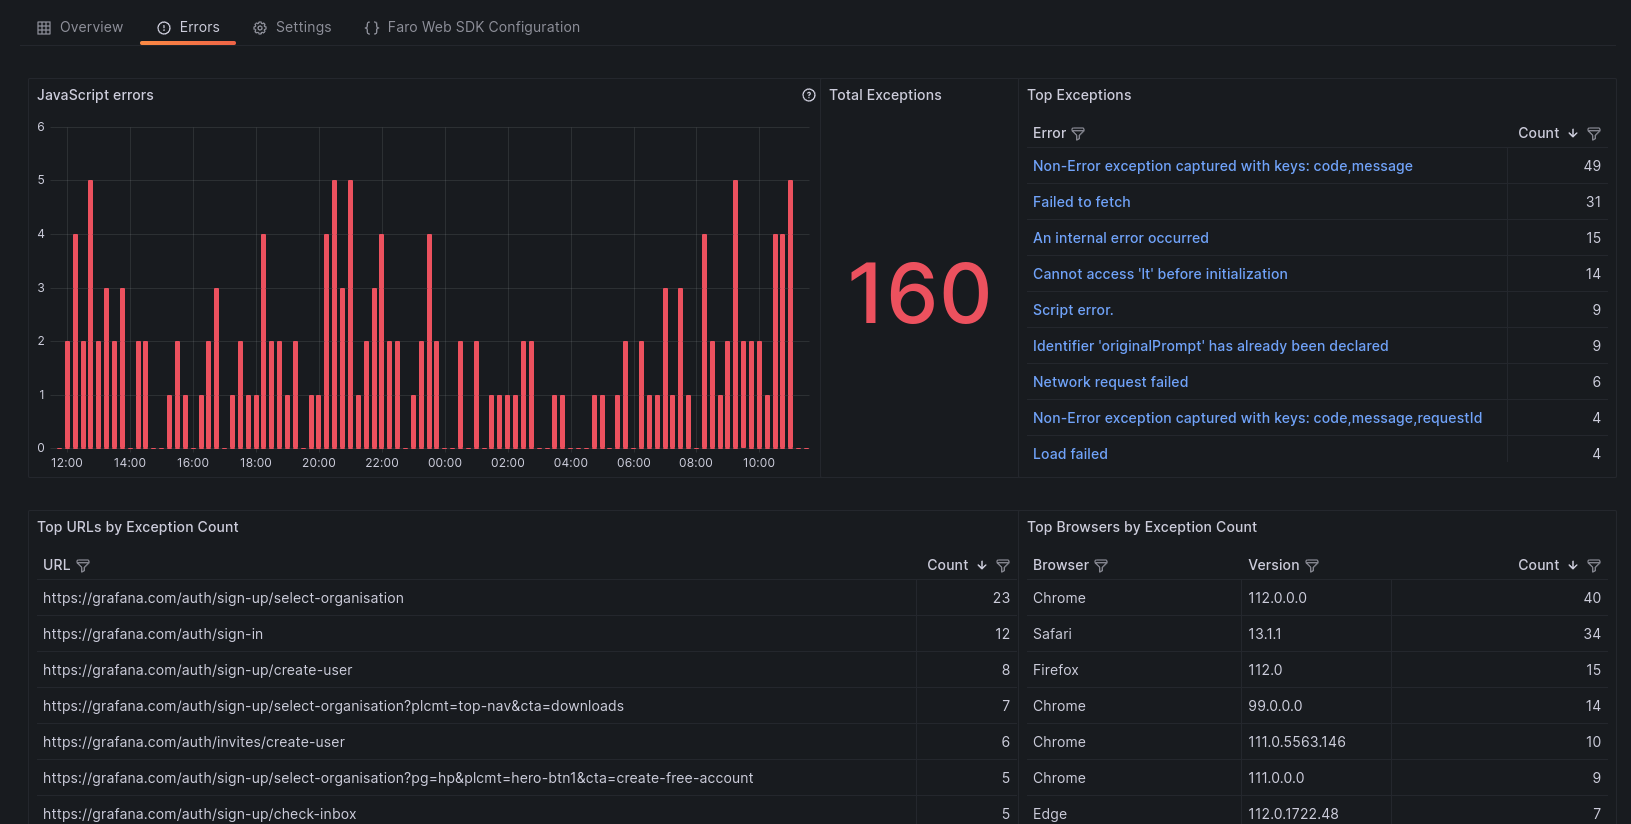
The Errors Overview page gives insights into your application’s errors:
- View how many errors your application is generating within a given time frame
- Filter results based on an error
- Filter out noisy errors
- Inspect error context: stack trace, session ids, metadata
- Identify dominant exceptions
- Identify URLs that are generating errors
- Segregate error count based on browsers
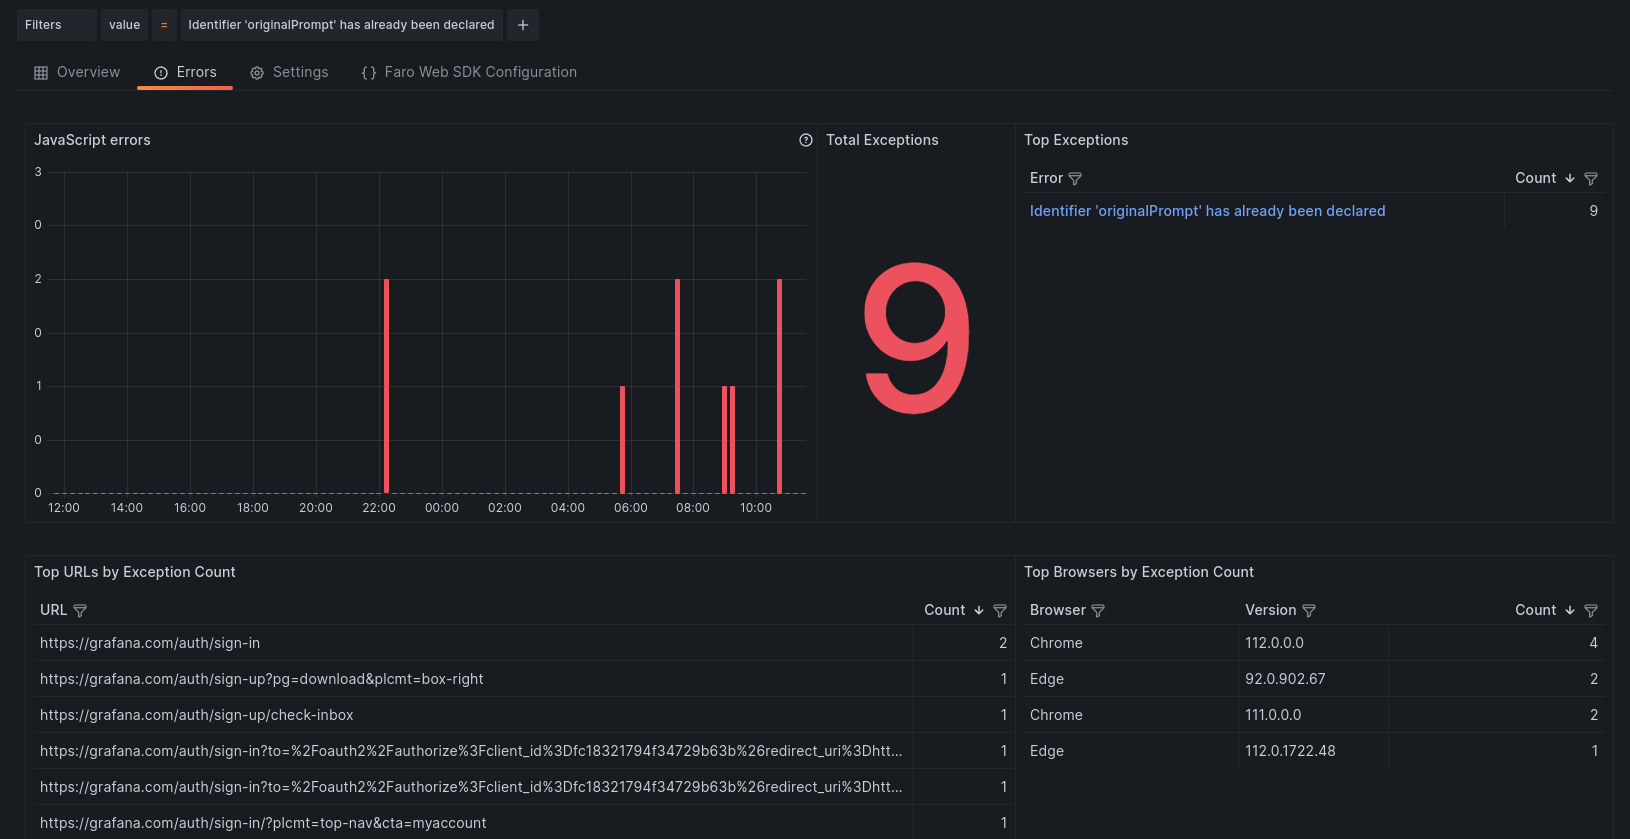
Filter results based on an error
To isolate the panels based on a specific errors:
- Navigate into the Top Exceptions panel
- Find the Error that you want to filter
- Click the ‘+’ sign, magnifying glass

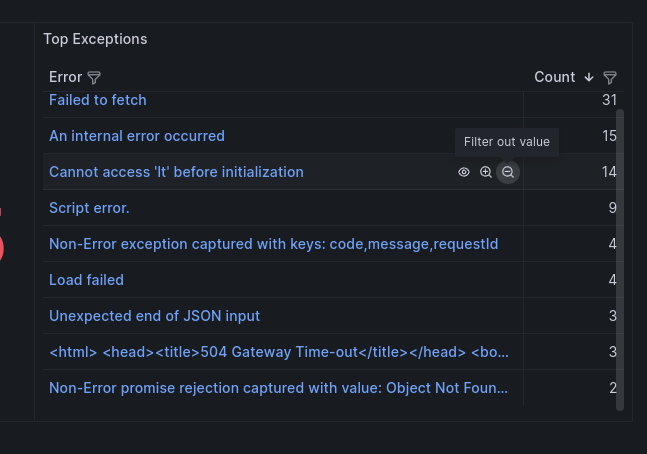
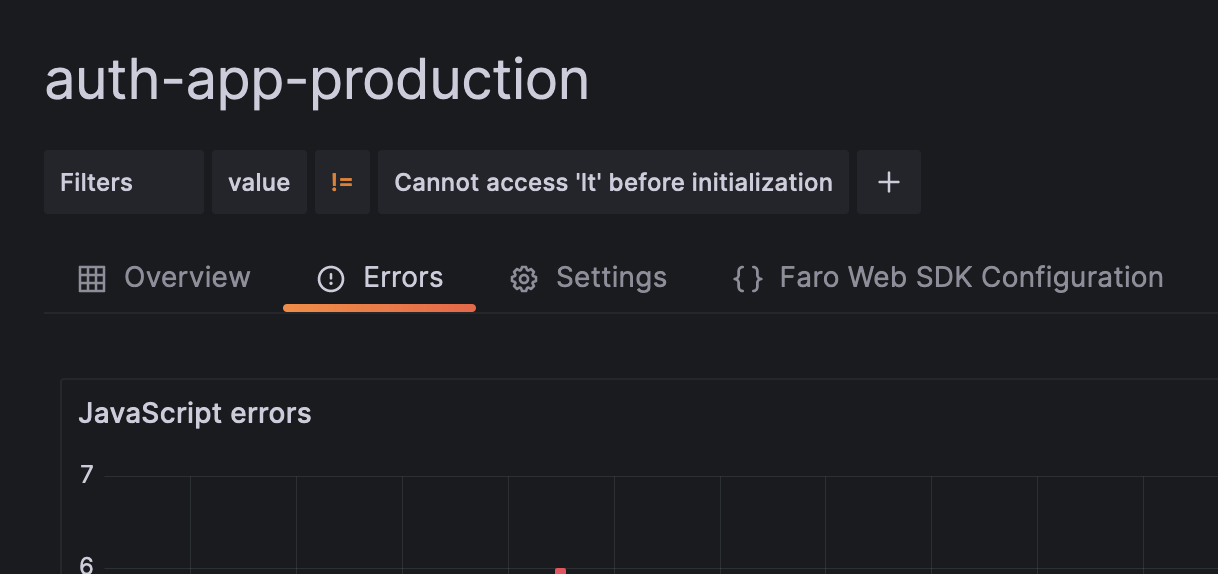
Filter out an error
To remove an error from the results:
- Navigate into the Top Exceptions panel
- Find the Error that you want to filter
- Click the ‘-’ sign, magnifying glass
View error context
To expand the Error and context: stack trace, browser, OS, and other metadata.
- Navigate into the Top Exceptions panel
- Find the Error that you want to filter
- Click the name of the blue colored error

You can follow the process above to filter based on:
- URL paths on the Top URLs by Exception Count panel
- Browser Name on the Browser column of the Top Browsers by Exception Count
- Browser Version on the Version column of the Top Browsers by Exception Count
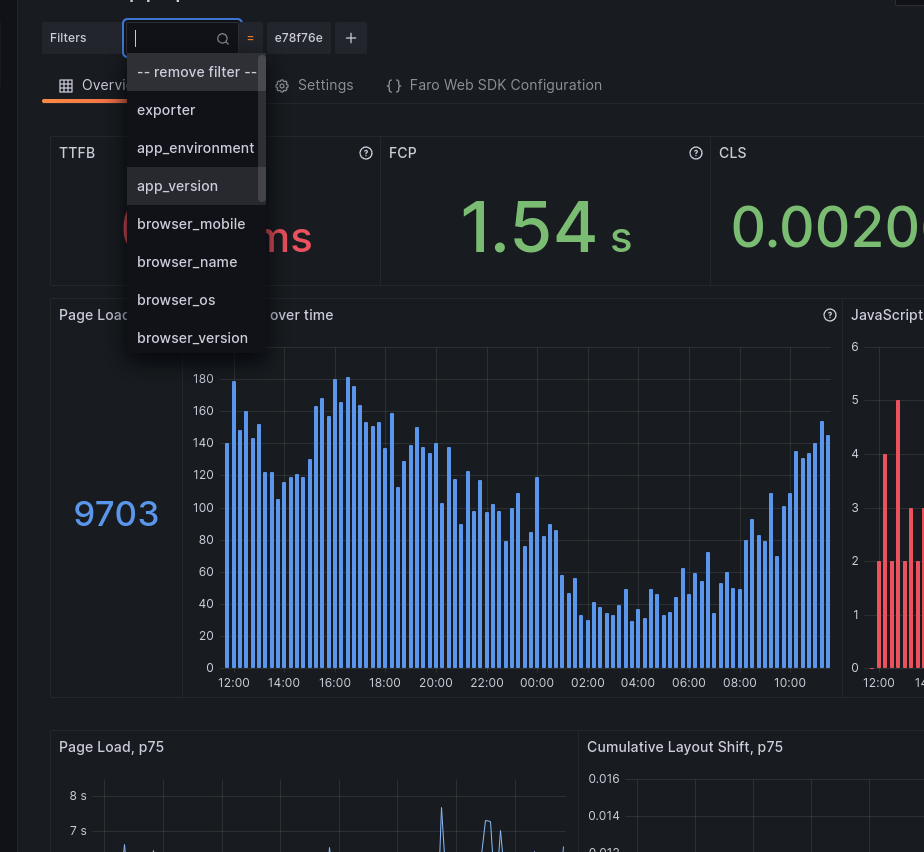
Adding a meta filter
You can also add other metadata filters as you would in the Performance Overview page. To add a meta filter:
- Click the ‘+’ button
- Select the meta label that you want from the drop-down
- Select the value from the drop-down

To edit a meta filter value:
- Click the value of the filter you want to change
- Select the new value from the drop-down
To remove a meta filter
- Click the label of the filter you want to remove
- Select ‘–remove filter–’ from top the drop-down list
Next steps
After identifying errors:
- Click an error to view the error context including stack traces and metadata
- Analyze related sessions to understand the user journey leading to errors
- Review performance metrics to see if errors correlate with performance issues
- Create alerts to get notified when error rates spike


