User actions in Frontend Observability
Use user actions in Grafana Frontend Observability to track key interactions in your application, such as button clicks or form submissions. User actions link related signals so you can monitor critical paths, identify issues, and measure adoption.
Before you begin
Ensure you have the following:
- A Grafana Cloud account with Frontend Observability enabled
- An application instrumented with the Faro Web SDK
Instrument user actions
Use the Faro Web SDK to instrument user interactions in your application. You can track user actions automatically using HTML attributes or manually using the API.
User action instrumentation is enabled by default in the Faro SDK. For configuration options and customization, refer to Monitor user actions.
faro.api.startUserAction('checkout-payment-submit', {
  orderId: '12345',
  amount: '299.99',
  currency: 'USD',
});
View user actions in Grafana
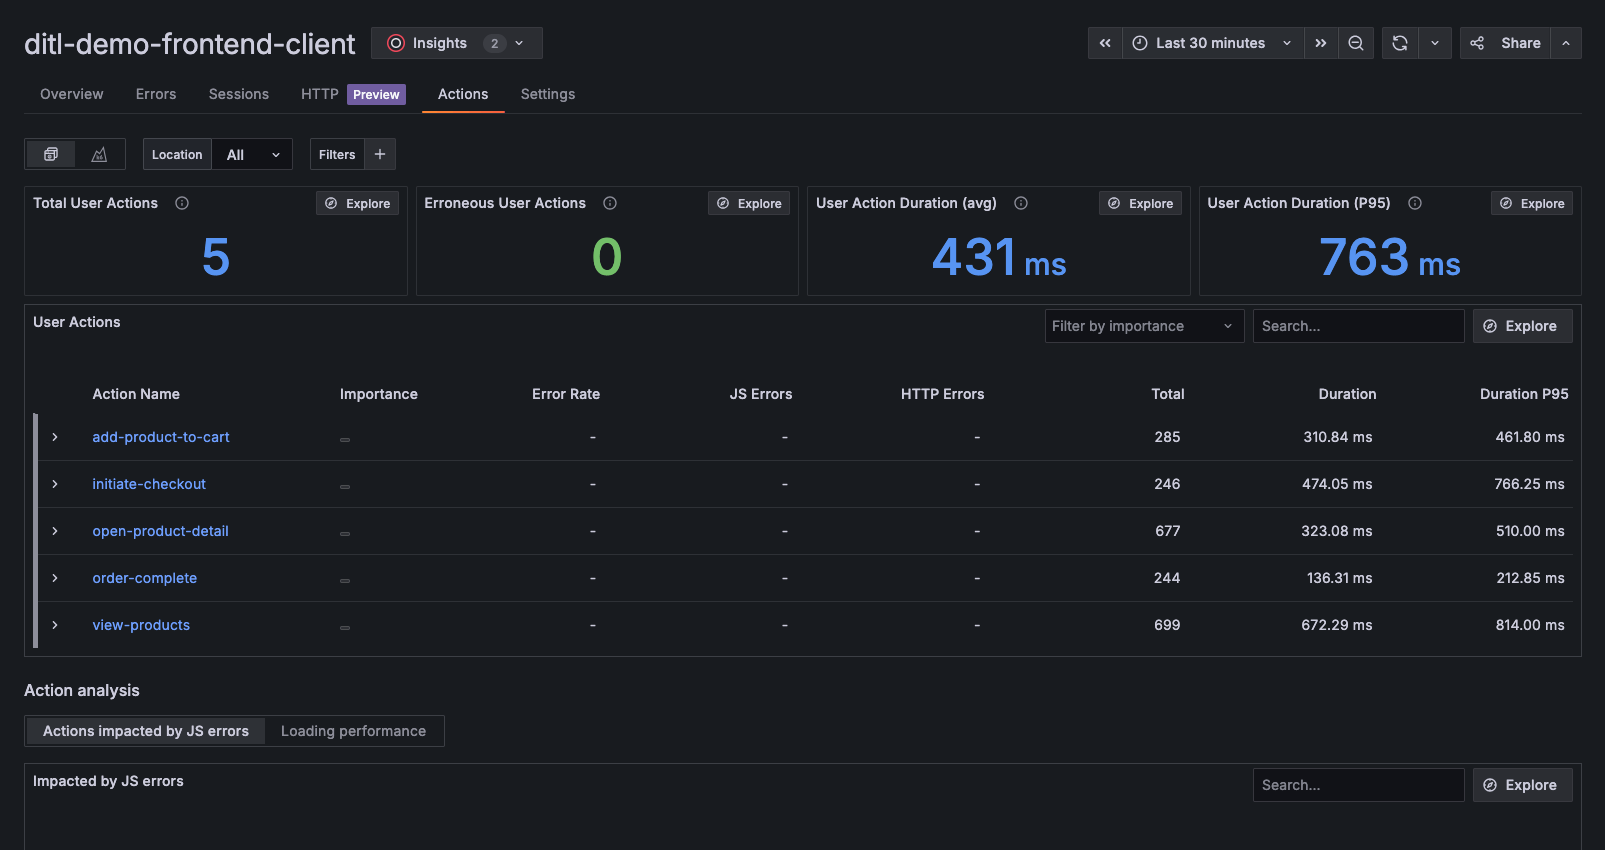
After you instrument user actions and send them to the collector, the Actions tab displays all user action data based on your selected time range.
At the top of the page, you can view:
- Total user actions: Displays the number of actions in the selected time range
- Erroneous user actions: Shows the number of actions with errors
- User action duration (avg): Shows the average time to complete an action
- User action duration (P95): Shows the 95th percentile duration for actions
The User Actions table lists all actions in the selected time range. For each action, you can review:
- Importance level
- Error rate
- Related JavaScript and HTTP errors
- Total executions
- Average and P95 durations
Use filters to focus on critical actions or search by action name.
Drill into a user action
Click an action to open its detail view. The detail view shows:
- Total executions and error rate
- Average duration and duration trend over time
- Related errors, executions, traces, HTTP requests, and sessions
- Resource usage, including request size and duration
Integrate with insights and the knowledge graph
User actions integrate with Grafana Knowledge Graph Insights to help you understand the broader impact of user experience issues.
- Correlate system issues with user actions to assess impact
- See related entities affected in the Knowledge Graph
- Open the Root Cause Analysis (RCA) workbench directly from the insights popover to investigate further
Troubleshoot user actions
This section helps you resolve common issues when working with user actions.
No actions appear
If you don’t see any user actions in your dashboard:
- Verify that your application uses the Faro Web SDK
- Confirm that actions are sent to the collector
- Ensure the
UserActionInstrumentationis included in your Faro configuration - Check the browser console for Faro-related errors
High error rates
If you see high error rates for specific actions:
- Use the Errors tab in the User Action detail view to identify related JavaScript or HTTP errors
- Review the timing of errors to identify patterns in the line graphs
- Use the Traces tab to view a set of related traces and analyze end-to-end traces
- Use the HTTP Requests tab to quickly see failed requests that may be contributing to errors.
- Use the Sessions tab to identify sessions with errors and view the user journey
Slow durations
If user actions take longer than expected:
- Compare average and P95 values to identify performance outliers
- Use the Traces or HTTP Requests tabs to find bottlenecks
- Look for patterns in specific browsers or user segments
Common use cases
User Actions help you monitor and optimize critical user journeys in your application. Here are examples of how you can use them.
E-commerce checkout flow
Track the complete checkout process to identify where users drop off.
The key actions to monitor include:
- Add to cart: Monitor how often users add items to their cart
- Proceed to checkout: Track conversion from cart to checkout
- Payment processing: Monitor payment success rates and identify payment failures
- Order confirmation: Track successful order completions
Use this data to:
- Identify checkout bottlenecks that cause cart abandonment
- Monitor payment gateway performance
- Optimize the checkout flow based on user behavior patterns
User authentication and onboarding
Monitor critical authentication and onboarding steps to optimize the user experience.
Monitor actions such as:
- User login: Track login success rates and identify authentication issues
- Password reset: Monitor password reset completion rates
- Account registration: Track new user registration success
- Profile setup: Monitor onboarding completion rates
Use this data to:
- Identify authentication system issues
- Optimize the onboarding experience
- Reduce user friction during account creation
Feature adoption and engagement
Track how users interact with key features to measure adoption and optimize placement.
Monitor the following actions:
- Feature discovery: Monitor when users first access new features
- Feature usage: Track repeat usage and performance of important features
- Settings configuration: Monitor user customization behavior
- Content interaction: Track engagement with specific content types
Use this data to:
- Measure feature adoption rates
- Identify underutilized features
- Optimize feature placement and visibility
Best practices for action tracking
Follow these guidelines to implement User Actions effectively and get the most value from your monitoring:
Choose meaningful action names
Use descriptive, consistent naming conventions for your user actions.
Examples of good and poor naming:
- Good:
checkout-payment-submit,user-profile-update,search-query-execute - Avoid:
click,button1,action-123
Use kebab-case (lowercase with hyphens) for consistency and readability.
Organize related actions with consistent naming patterns:
checkout-cart-add
checkout-cart-remove
checkout-payment-start
checkout-payment-complete
checkout-order-confirm
Prioritize critical actions
Focus on tracking actions that have the greatest impact on your users and business. Not every interaction needs to be instrumented. Prioritize based on importance:
High priority: Actions that directly affect business outcomes or critical workflows. Examples: checkout and payment, account creation, login, onboarding, search, and navigation.
Medium priority: Actions that help you optimize adoption and engagement. Examples: new feature usage, settings changes, content interaction, social sharing.
Low priority: Actions that are less critical to user or business outcomes. Examples: theme changes, footer link clicks, decorative interactions.
When deciding what to track, focus on:
- Key milestones in user journeys such as checkout or onboarding steps.
- Business metrics like revenue or retention that align with tracked actions.
- Error-prone workflows where failures commonly occur.
- Conversion funnels to understand drop-off points.
Mark critical actions appropriately
Mark critical actions with the critical severity flag so they stand out in Grafana.
Include relevant context
Add meaningful attributes to provide context for analysis.
Example:
faro.api.startUserAction('product-purchase', {
  productId: 'abc123',
  category: 'electronics',
  price: '299.99',
});
Monitor action performance
Keep an eye on key performance indicators to identify issues early.
Monitor the following metrics:
- Action duration: Monitor for actions that take unusually long to complete
- Error rates: Track which actions fail most frequently


