Analyze HTTP request health and performance
HTTP insights help you assess the health and performance of requests sent by your frontend applications. The feature provides quick insights at a glance with detailed breakdowns and correlation charts. This helps you understand impact and how important performance metrics relate to each other.
HTTP insights can help you to do the following:
- Monitor real user experience metrics
- Identify performance degradation trends
- Correlate errors with traffic spikes or performance issues
- Optimize content delivery and server response times
- Track the impact of changes on user-facing performance
To narrow down the scope of your data, set filters and choose specific locations. You can use the button on the left hand side of the dashboard toolbar to include Grafana k6 data, which merges lab data with field data. Use this feature with caution to avoid skewing your results. Field data typically provides the most relevant insights for user session analysis.
HTTP insights data sources
HTTP insights use data from automatic Faro instrumentations. No additional configuration is required if you use the standard Faro setup.
Automatic instrumentations
The dashboard uses these auto-instrumentations:
@opentelemetry/instrumentation-fetch: Captures data fromfetchAPI callsFaroXhrInstrumentation: Wrapper for@opentelemetry/instrumentation-xml-http-requestthat capturesXMLHttpRequestdata- Performance Resource Timeline instrumentation: Part of Faro core auto-instruments that collects network timing data
Both the fetch and XHR instrumentations are automatically included through the TracingInstrumentation from the @grafana/faro-web-tracing package.
How to find these events outside of the HTTP dashboard
All events are stored in Loki and, in the case of events sent by the web-tracing instrumentation, in Tempo as well.
Web tracing package:
- Sidecar events for each request are available in Loki with
event_name=faro.tracing.xml-http-requestfor XHR requests andevent_name=faro.tracing.fetchfor fetch requests - The logs contain the span context of the related span
- You can find all spans in Tempo for end-to-end visibility
Performance Resource Timeline instrumentation:
- All events are stored in Loki with
event_name=faro.performance.resource
Setup requirements
If you use the copy-and-paste snippet from Grafana Frontend Observability, these instrumentations are already configured. If you don’t have the tracing package installed, refer to Integrate OpenTelemetry-JS tracing for setup instructions.
The performance resource timeline instrumentation is included by default with Faro core auto-instruments.
HTTP insights overview
The HTTP insights landing page displays an overview dashboard that groups HTTP requests by domain. This provides a high-level view of request performance across all domains accessed by your frontend application.
To analyze HTTP requests for a specific domain, click the links in any of the tables. This opens the drilldown page for that domain, which provides detailed insights at the individual HTTP request level. The drilldown page contains the same panels as the overview except a HTTP requests table at the bottom that shows individual request details.
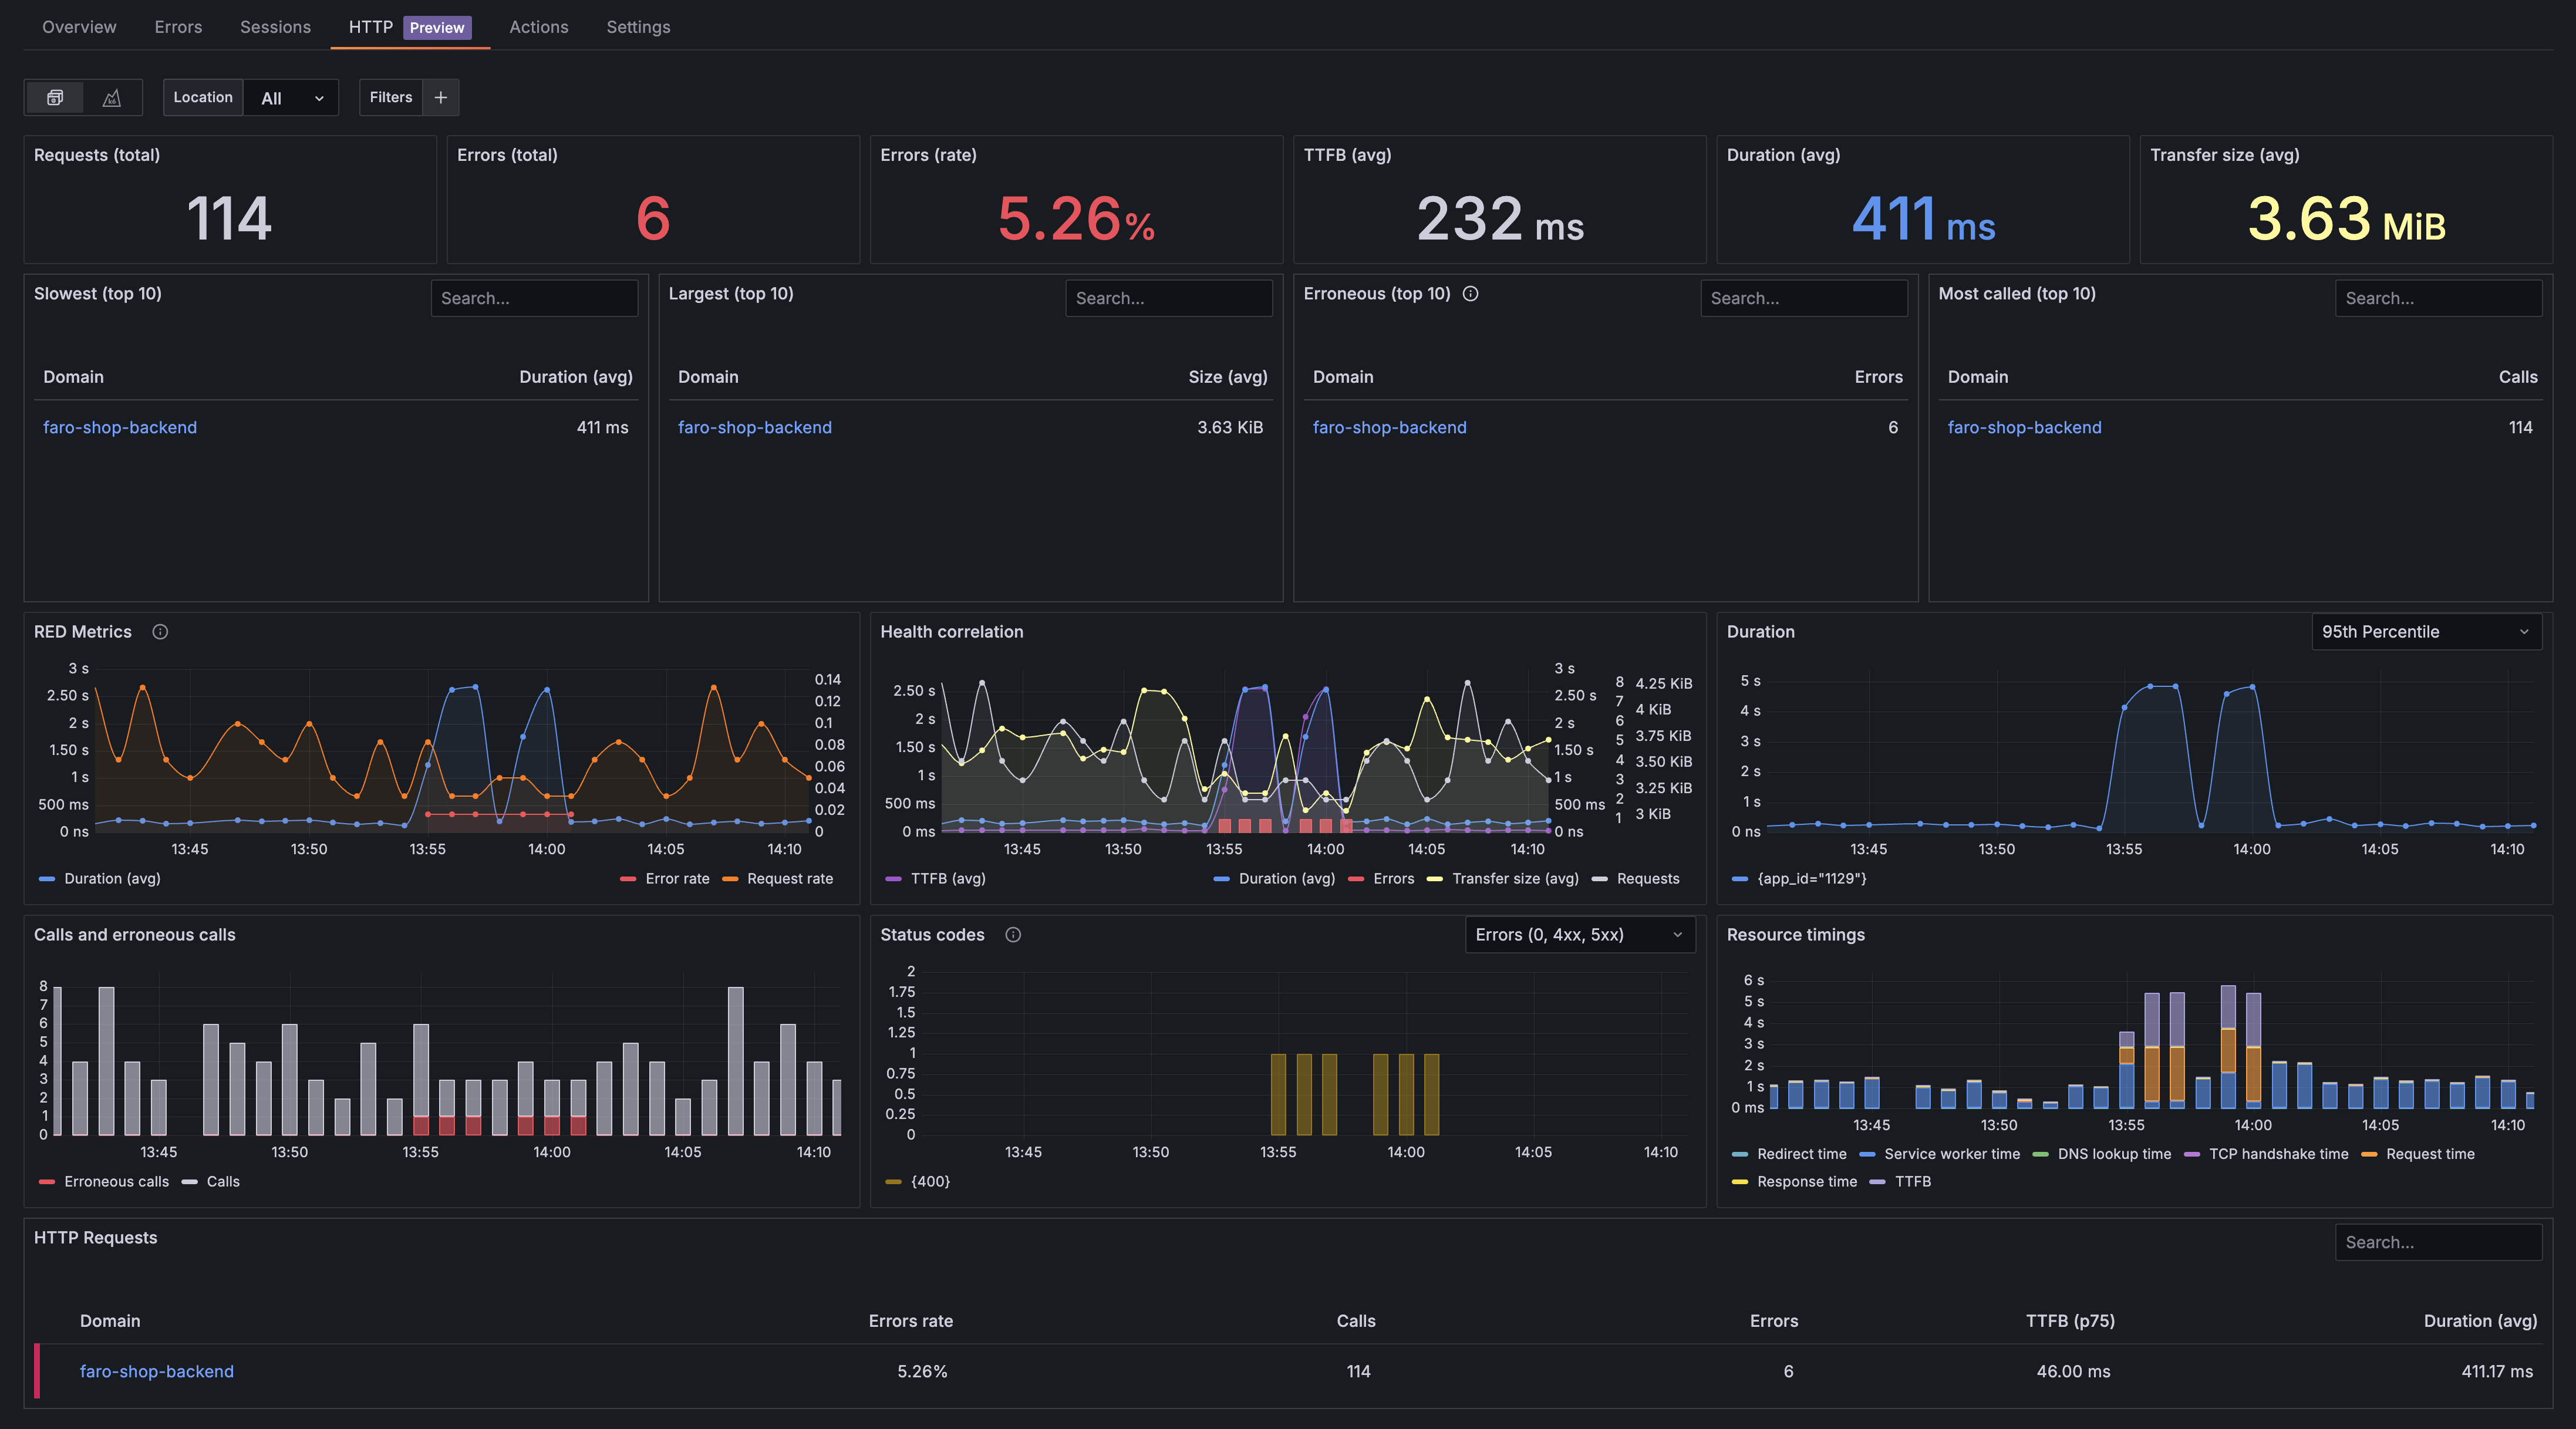
KPI row
The first row displays key performance indicators that provide important overall statistics about the health and performance of HTTP requests sent by your frontend application.

The KPI row provides an overview of the following:
- Requests (total): Total HTTP request count for all status codes
- Errors (total): Count of erroneous HTTP requests, which include network failures (status code 0) and client/server errors (4xx and 5xx status codes)
- Errors (rate): Percentage of erroneous HTTP requests that helps you interpret the real impact of HTTP errors by showing errors in relation to the total number of requests
- TTFB (avg): Average
Time To First Bytefor all HTTP requests sent, which indicates server performance and network latency - Duration (avg): Average duration of the complete HTTP request cycle that provides information about the overall performance of HTTP requests sent by your site
- Transfer size: Average transfer size including response headers and response body
Health and performance row
The health and performance row provides insights into HTTP request metrics over time and shows how different performance indicators correlate. This helps you assess issue severity and identify root causes by highlighting visual patterns that help narrow down timing and scope to isolate problems.
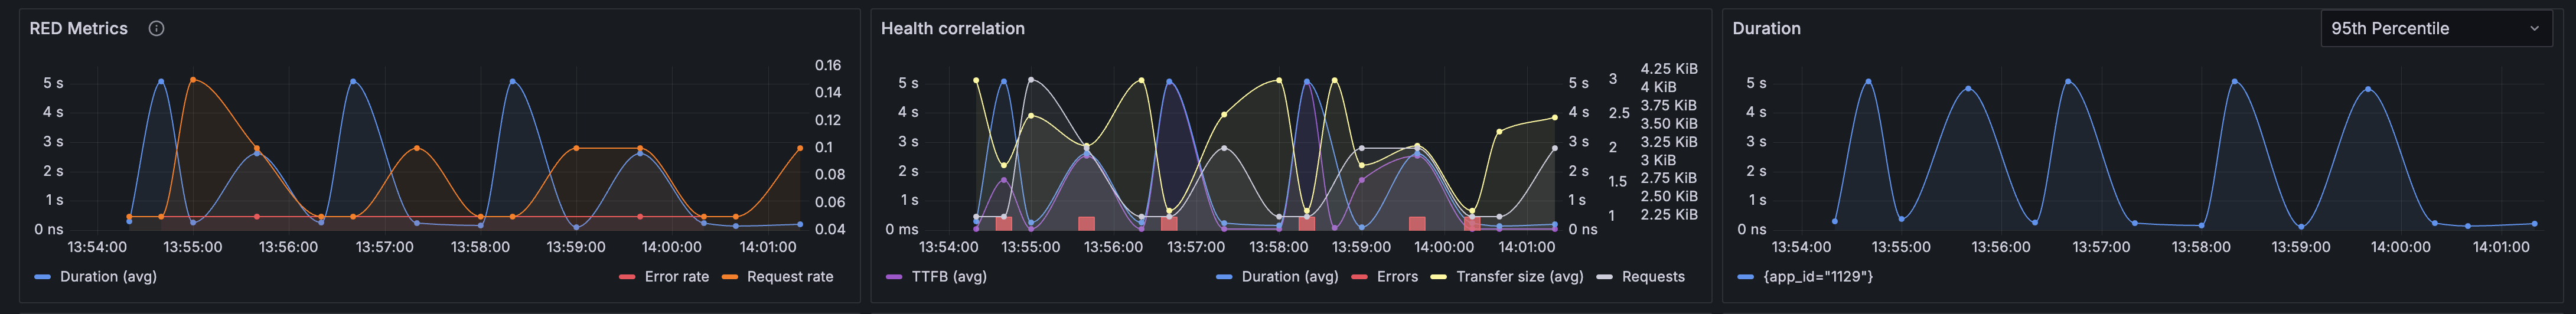
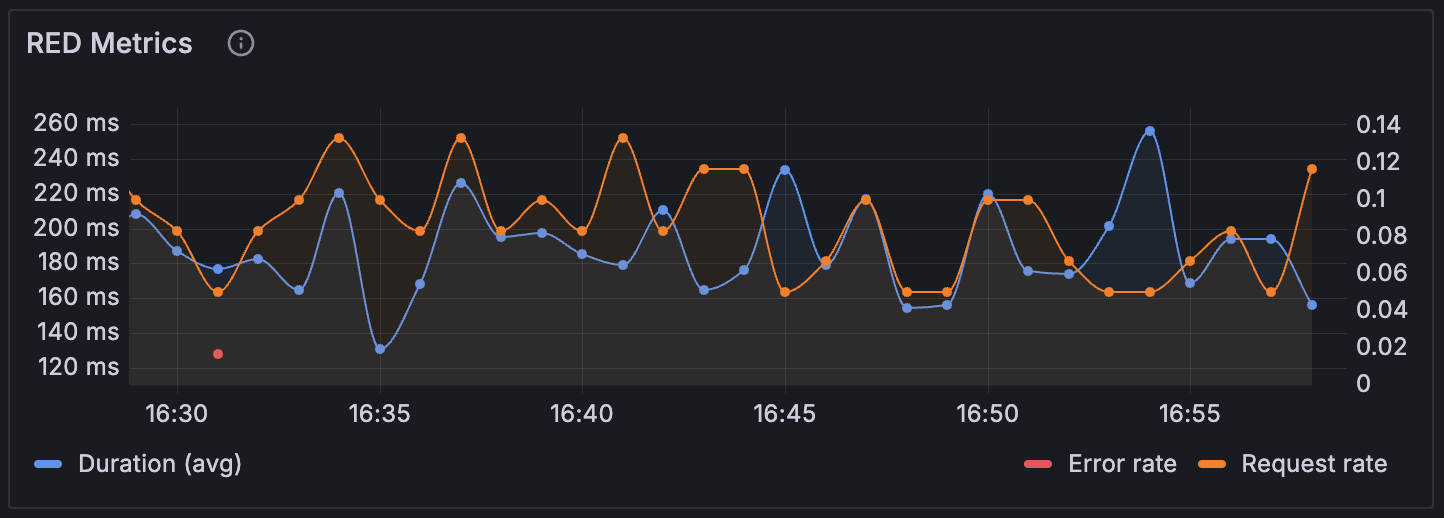
RED metric panel
The RED metrics panel shows three critical observability metrics for HTTP requests:
- Rate: The number of HTTP requests per second that your frontend application generates, helping you understand traffic patterns and user activity levels
- Errors: The count and percentage of failed HTTP requests, including network failures (status code 0) and client/server errors (4xx and 5xx status codes)
- Duration: Total request duration, which indicate both server performance and network conditions affecting your users
These metrics provide a comprehensive view of your frontend application’s HTTP request health and performance, enabling you to quickly identify issues and understand their impact on user experience.
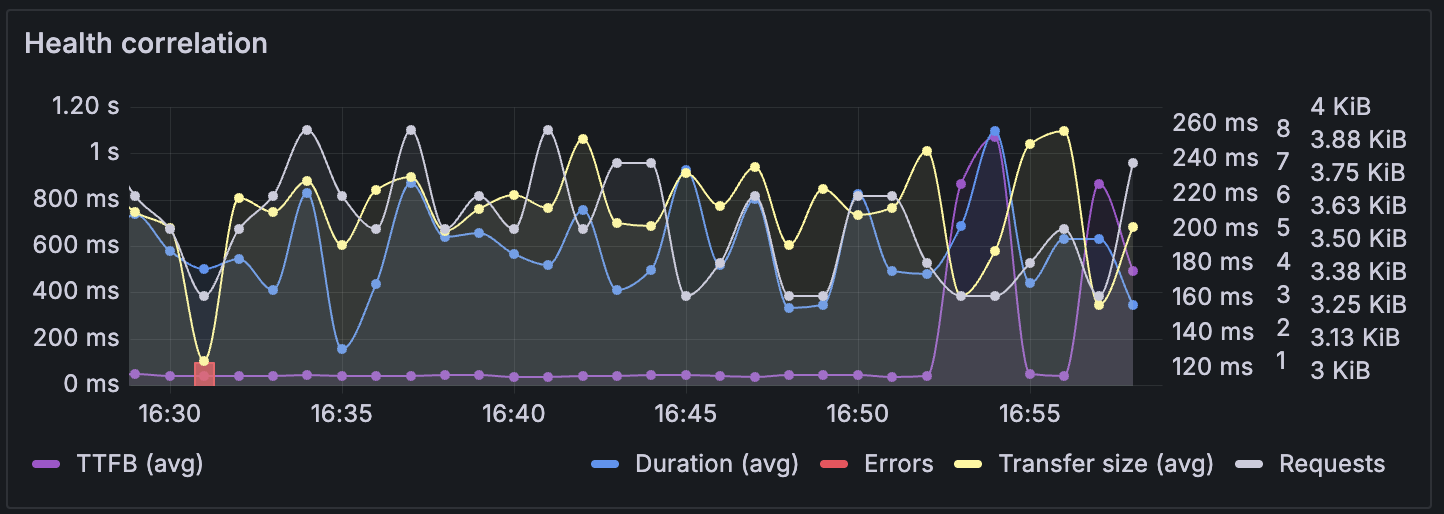
Health correlation panel
The health correlation panel provides a comprehensive view of web application performance metrics from a client perspective. It displays key indicators that help identify performance bottlenecks and reliability issues. The panel visually correlates metrics, helping you easily spot patterns and understand how different performance indicators relate to each other.
Use this panel to identify performance relationships. For example:
- Transfer size changes: Monitor sudden changes in data transfer that might indicate content issues
- Server performance problems: Identify server issues when Time To First Byte approaches total request duration
This correlation view enables you to quickly diagnose whether performance issues stem from server problems, network conditions, or application-specific factors and how they correlate.
Metrics displayed
Time-Based Metrics
TTFB (Time to First Byte) - Average: Shows the average time between when a client sends a request and receives the first byte of response from the server. Lower values indicate better server responsiveness.
Duration - Average: Displays the average total time for complete request-response cycles, including network latency and processing time.
Volume metrics
- Transfer Size - Average: Shows the average amount of data transferred, helping identify potentially oversized responses that may impact performance.
- Requests Over Time: Visualizes the volume of requests being made to the application over the selected time period, useful for understanding traffic patterns and load.
Count based metrics
- HTTP Errors: Displays error counts as bars, providing visibility into request failures, timeouts, and other issues that affect user experience and performance.
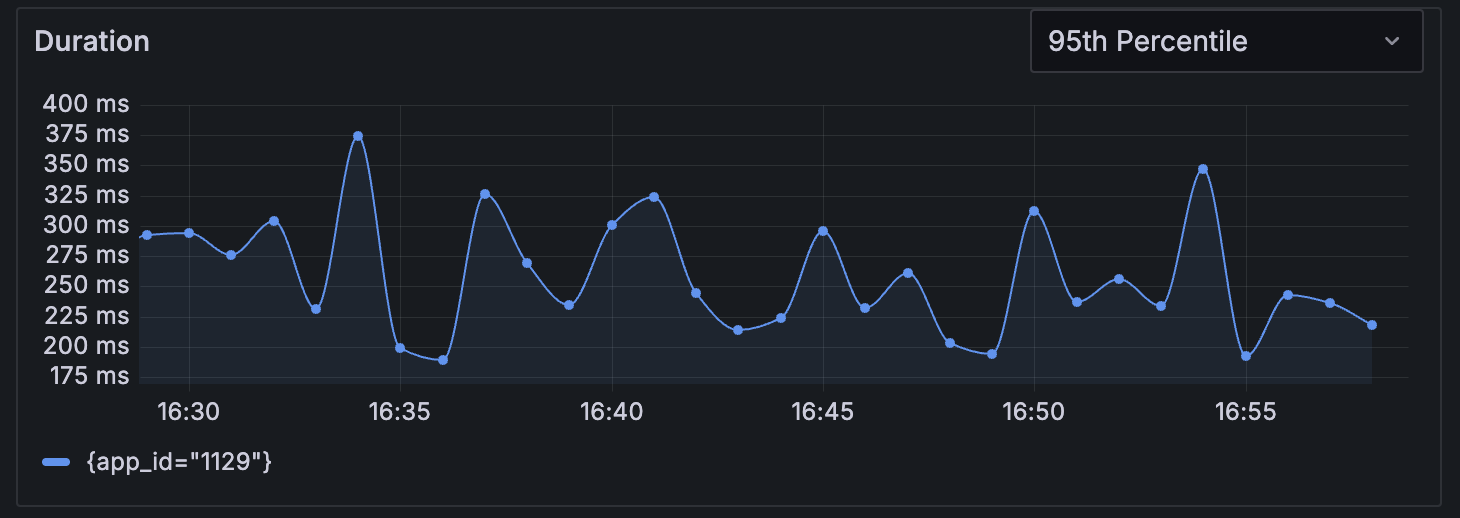
Duration panel
The duration panel displays HTTP request duration over time as a line chart, showing how your frontend application’s request performance varies throughout the selected time period. This visualization helps you identify performance trends, spot anomalies, and understand how request latency affects user experience.
You can choose from the following multiple percentile views to analyze different aspects of request performance:
- p99 (99th percentile): Shows the duration experienced by your slowest 1% of requests, helping identify worst-case scenarios and performance outliers
- p90 (90th percentile): Shows duration for the slowest 10% of requests, indicating performance problems that impact a notable user segment
- p75 (75th percentile): Displays duration for the slowest 25% of requests, providing a balanced perspective on typical user experience
- p50 (50th percentile): Displays duration for the slowest 50% of requests
- Average: Shows the mean request duration across all requests, useful for understanding overall performance trends
Use this panel to:
- Monitor performance degradation over time
- Correlate performance issues with traffic patterns or deployment events
- Compare different percentiles to understand the distribution of request durations
- Identify peak usage periods that may impact performance
- Track the effectiveness of performance optimizations
Breakdowns row
The breakdowns row contains panels that show breakdown analytics for HTTP requests, providing detailed insights into request patterns, error distributions, and performance characteristics.
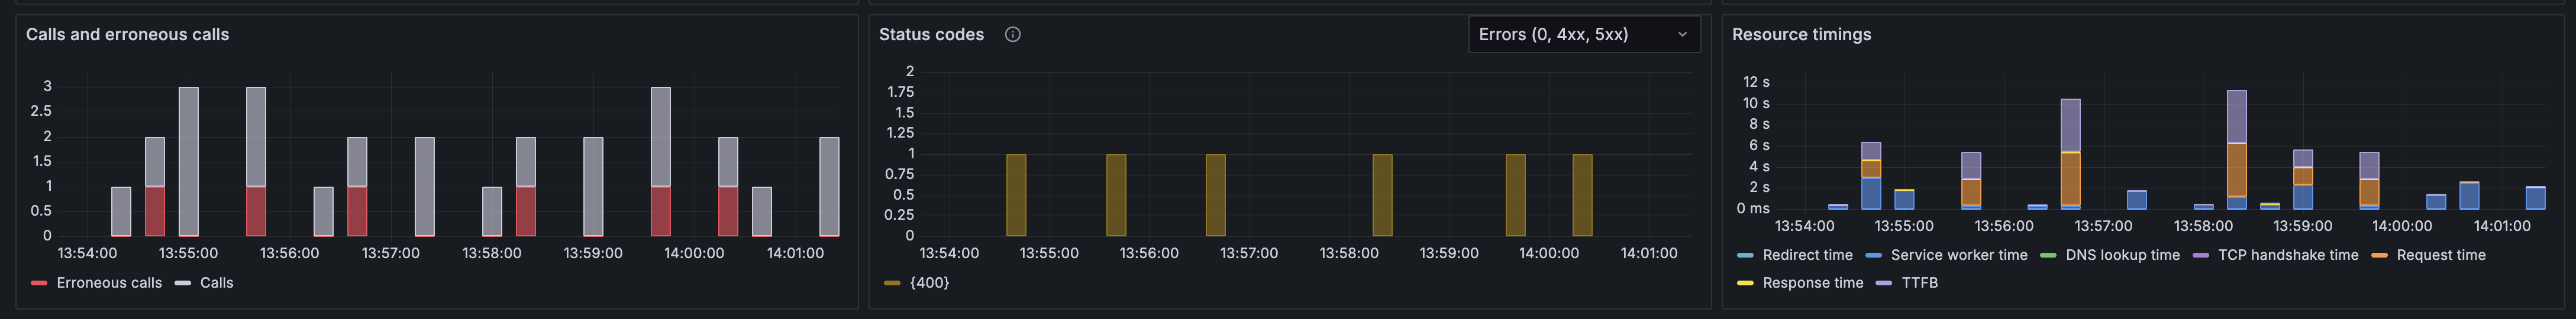
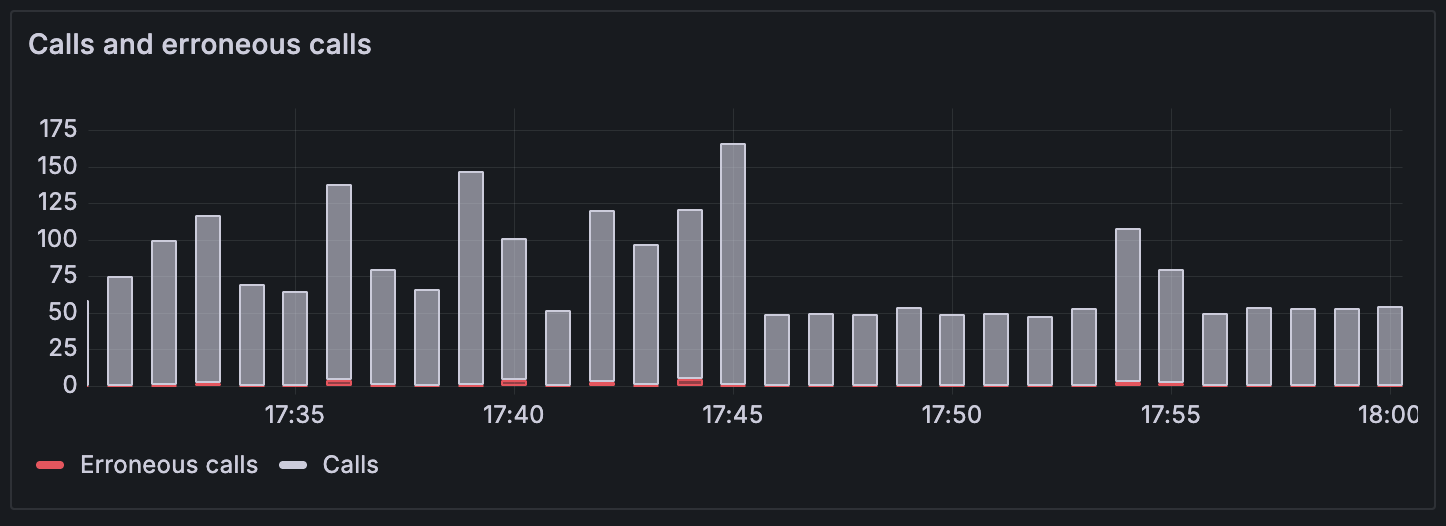
Calls and erroneous calls
This panel displays the distribution of HTTP requests categorized by their success or failure status. It shows both successful calls and erroneous calls, helping you understand request reliability patterns.
The panel tracks:
- Successful calls: HTTP requests that completed successfully with 2xx and 3xx status codes
- Erroneous calls: Failed requests including network failures (status code 0), client errors (4xx), and server errors (5xx)
Use this visualization to:
- Monitor error rates and identify spikes in failed requests
- Correlate error patterns with traffic volume changes
- Track the impact of deployments or configuration changes on request success rates
- Assess overall application reliability from the client perspective
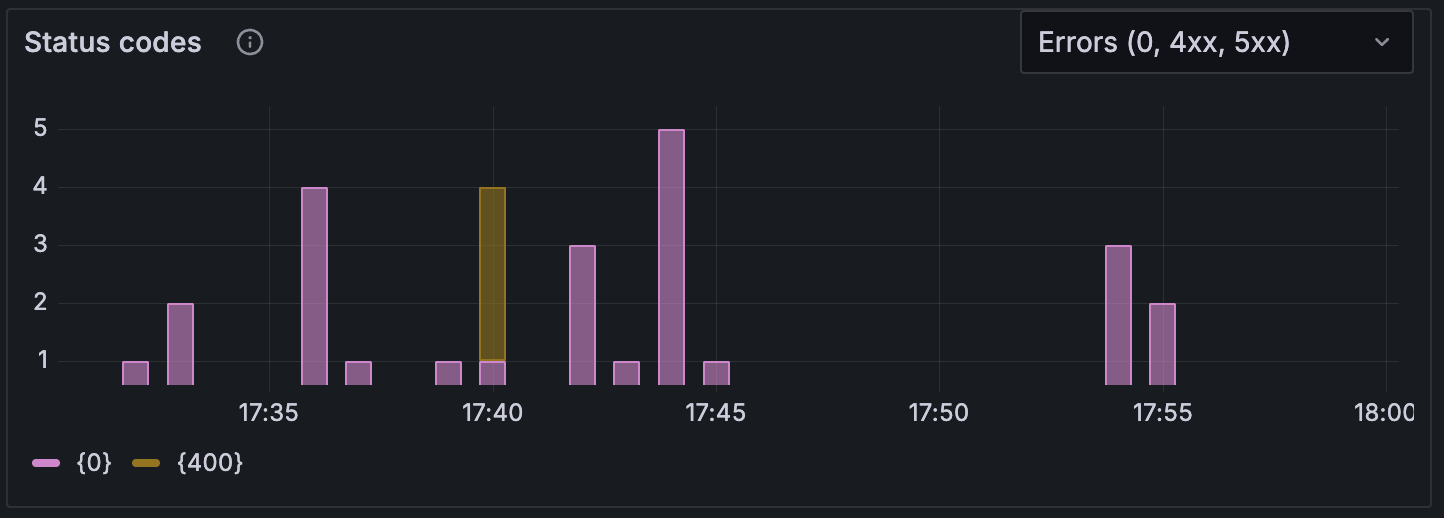
HTTP status codes
This panel provides a breakdown of HTTP requests by their response status codes, giving you detailed insights into response patterns and error distributions. By default, the panel shows only error codes to highlight issues at a glance, but you can view all status codes using the dropdown menu.
This panel shows the distribution of HTTP responses across different status code categories:
Common status code categories include:
- 2xx Success: Successful requests (200 OK, 201 Created, 204 No Content)
- 3xx Redirection: Redirect responses (301 Moved Permanently, 302 Found, 304 Not Modified)
- 4xx Client Error: Client-side errors (400 Bad Request, 401 Unauthorized, 404 Not Found)
- 5xx Server Error: Server-side errors (500 Internal Server Error, 502 Bad Gateway, 503 Service Unavailable)
- 0 Network Error: Network failures and timeouts
This breakdown helps you:
- Identify specific types of errors affecting your users
- Distinguish between client-side and server-side issues
- Monitor redirect patterns and caching effectiveness
- Track network connectivity problems
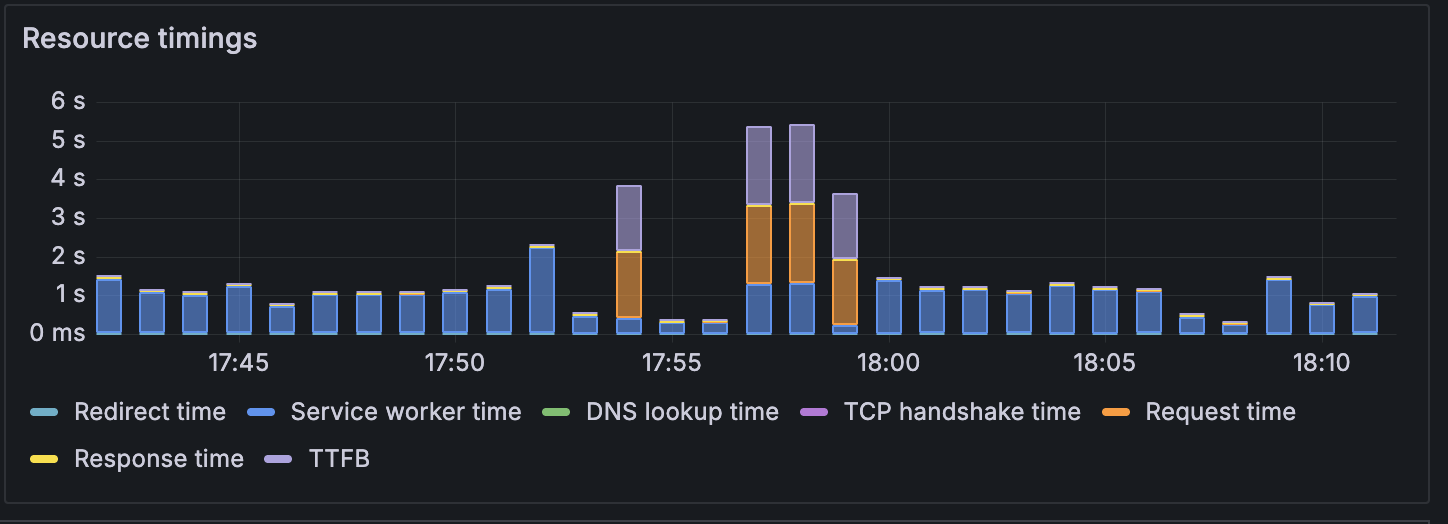
Resource load timings
The resource load timings panel breaks down HTTP request performance into detailed timing phases, providing insights into where time is spent during the request lifecycle.
The following metrics are displayed in the panel:
- Redirect time: Time spent following HTTP redirects before reaching the final destination
- Service worker time: Time for service worker processing and response handling
- DNS lookup time: Time spent resolving domain names to IP addresses
- TCP handshake time: Time to establish TCP connections to servers
- Request time: Time to send the request to the server
- Response time: Time to receive the response data
- TTFB (Time to First Byte): Time from request initiation until the first byte of response is received
These detailed timing breakdowns help you:
- Identify network related performance bottlenecks
- Optimize DNS resolution and connection management
- Understand server processing efficiency
- Diagnose whether performance issues originate from network conditions or server response times
- Track the impact of CDN usage and geographic distribution on load times
HTTP Requests by domain table
The HTTP requests table on the overview page provides a comprehensive overview of HTTP request performance grouped by domain. This table helps you quickly identify problematic domains and prioritize optimization efforts by showing key performance metrics at a glance.
The table displays the following columns:
- Errors rate: Percentage of failed requests for each domain, including network failures (status code 0) and client/server errors (4xx and 5xx status codes)
- Calls: Total number of HTTP requests made to each domain during the selected time period
- Errors: Absolute count of failed requests for each domain, providing context for the error rate percentage
- TTFB (p75): 75th percentile Time To First Byte, indicating server response performance where 75% of requests respond faster than this value
- Duration (avg): Average total request duration for all requests to each domain, including network latency and processing time
Use this table to:
- Identify domains with the highest error rates that need immediate attention
- Compare performance characteristics across different domains and services
- Prioritize optimization efforts based on request volume and performance impact
- Correlate domain-specific issues with overall application performance
- Click on any domain name to drill down into detailed request-level analysis for that specific domain
The table includes a visual indicator on the right side of each row that highlights domains requiring immediate attention. This indicator turns red when the error rate exceeds 5%, helping you quickly identify problematic domains that may be impacting user experience. It provides sortable columns, allowing you to organize data by any metric to quickly identify the most critical performance issues.

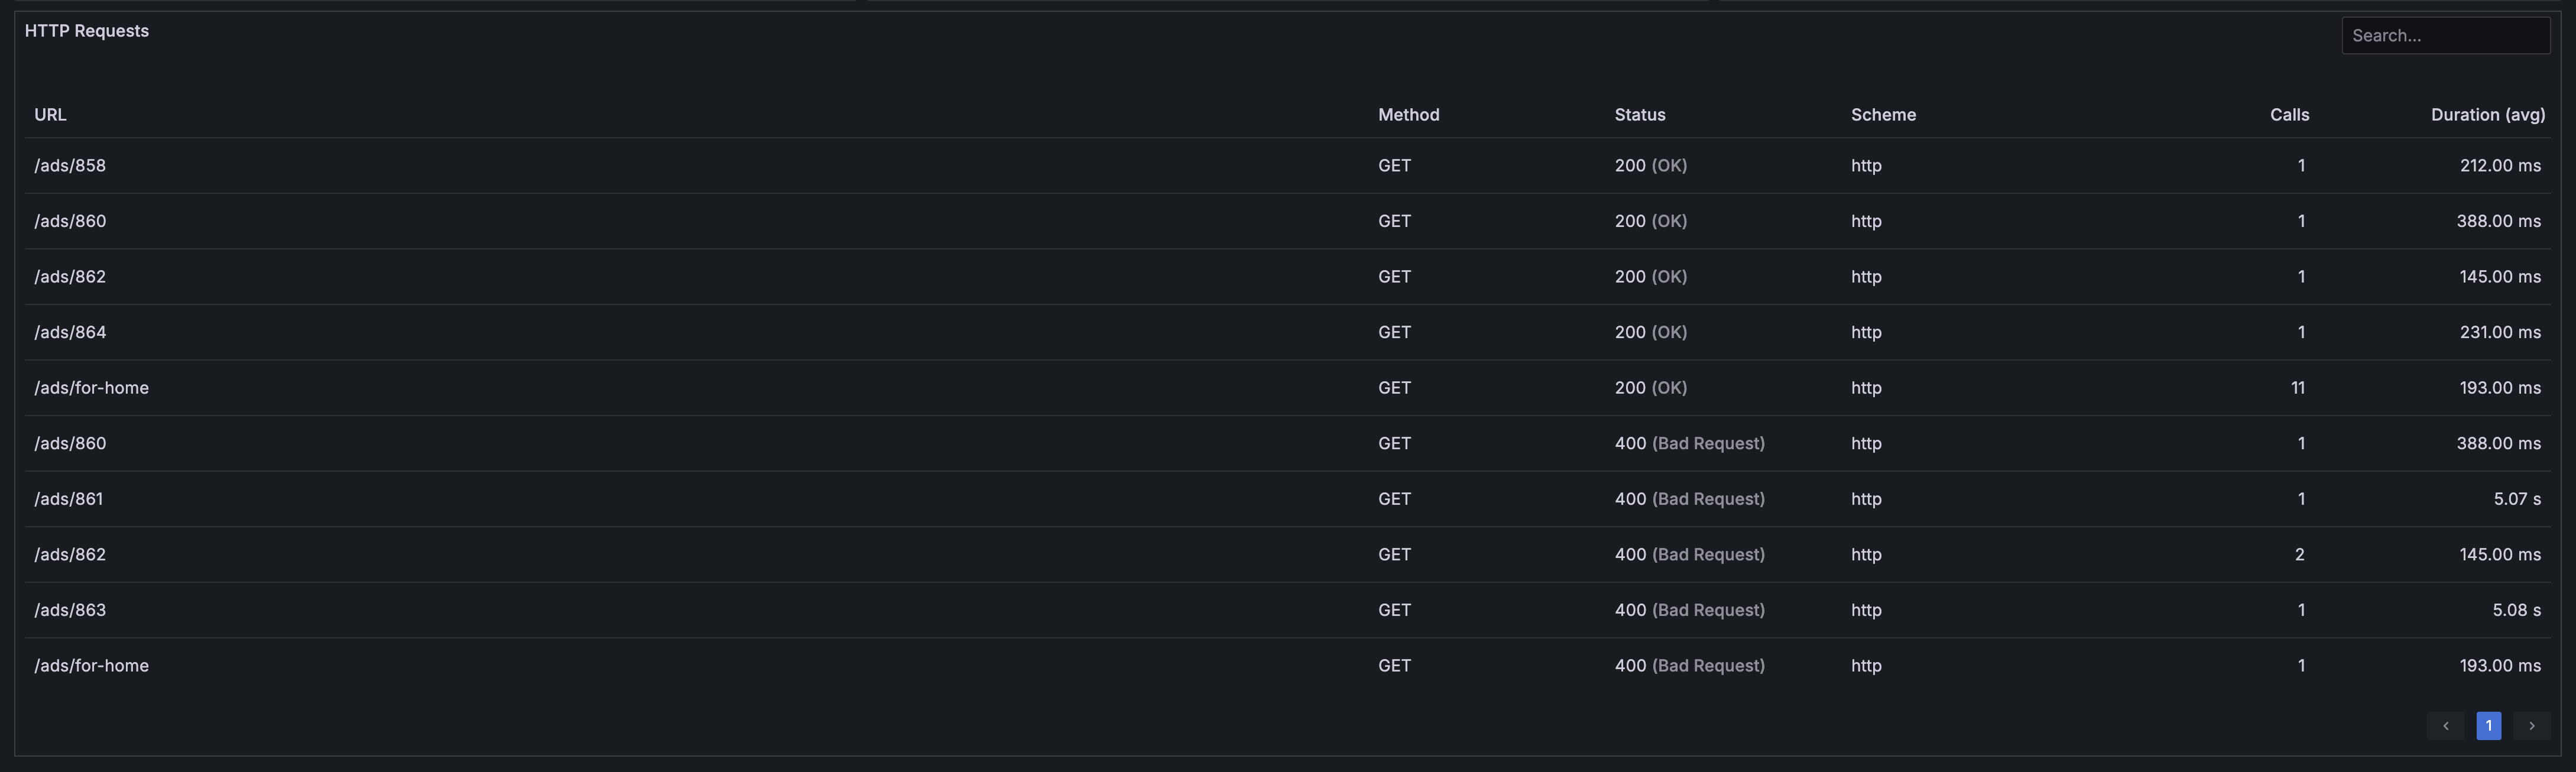
HTTP Requests table
The HTTP requests table on the drilldown page displays individual HTTP requests with detailed performance data for a specific domain. This table provides granular insights into request-level performance, helping you identify specific endpoints or request patterns that may be causing issues.
The table displays the following columns:
- URL: The complete request URL or endpoint path without the domain, showing the specific resource or API endpoint being accessed
- Method: HTTP method used for the request (GET, POST, PUT, DELETE, PATCH, etc.), indicating the type of operation being performed
- Status: HTTP response status code received for the request, providing immediate visibility into success or failure states
- Scheme: Protocol scheme used for the request (http, https), showing security and protocol information
- Calls: Total number of requests made to this specific URL during the selected time period, indicating usage frequency
- Duration (avg): Average request duration for this specific URL, helping identify slow performing endpoints
Use this table to:
- Identify specific URLs or endpoints with performance issues
- Compare request patterns across different HTTP methods
- Spot frequently accessed resources that may benefit from optimization
- Correlate specific status codes with particular endpoints
- Track the performance impact of individual API calls or resource requests
- Prioritize optimization efforts based on both frequency and duration
The table provides sortable columns, allowing you to organize data by any metric to quickly identify the most critical performance issues.