Examine query samples
Query samples capture actual query executions from your database, including the specific execution time, duration, and associated wait events. Use samples to understand real-world query behavior and identify patterns that aggregated metrics might miss.
What query samples capture
Unlike aggregated metrics that show averages and totals, query samples capture individual query executions. Both MySQL and PostgreSQL samples include the timestamp, duration, database/schema, CPU time, wait events, and full query text (shown when redaction is disabled). Beyond these shared fields, each engine provides additional details.
MySQL samples
MySQL samples include resource and row-level metrics from Performance Schema:
PostgreSQL samples
PostgreSQL samples include connection and process context from pg_stat_activity:
Why query samples matter
Aggregated metrics can hide important patterns:
- Bimodal distributions: A query might usually take 10ms but occasionally take 10 seconds
- Parameter-specific issues: Certain parameter values might cause slow execution
- Time-based patterns: Performance might degrade during specific time windows
- Correlation with events: You can match slow queries with application events
Access query samples
To view samples for a query:
- Navigate to Database Observability in Grafana Cloud.
- In Queries Overview, click a query to open its details.
- Select the Query Samples tab.
- View the time series chart and sample list.
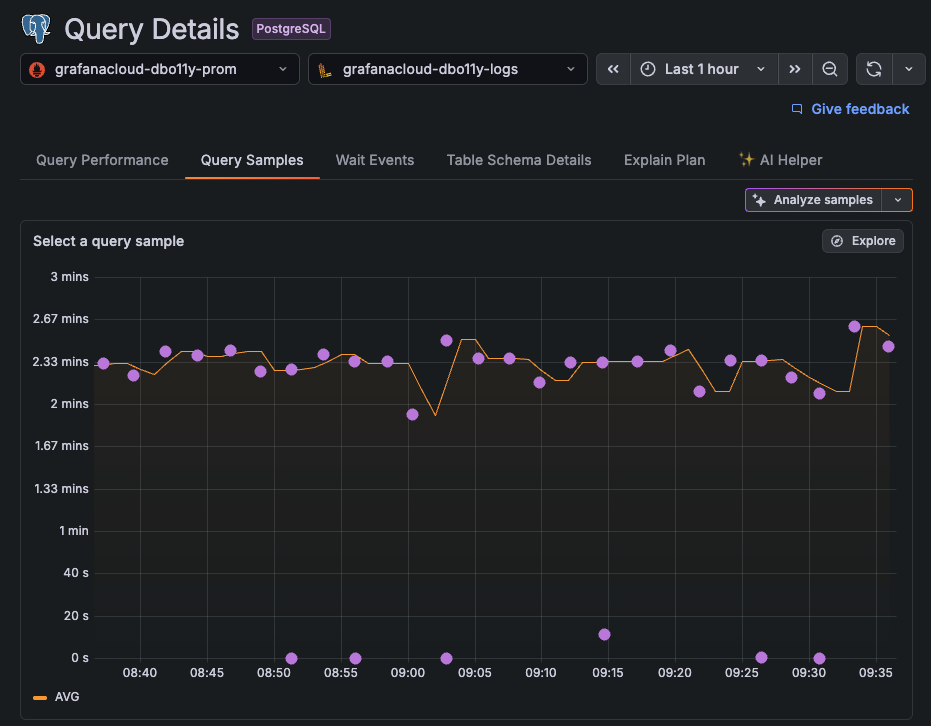
Time series visualization
The Query Samples tab shows a chart of sample executions over time:
- X-axis: Time
- Y-axis: Query duration
- Points: Individual query executions
Hover over a point to see a tooltip with sample details. The fields shown vary by database engine — refer to the table above for the full list. Click a sample to select it and view the full query text (when redaction is disabled).
View full query text
By default, Database Observability redacts query parameters for security:
Redacted:
SELECT * FROM users WHERE email = ?Full text (when redaction disabled):
SELECT * FROM users WHERE email = 'user@example.com'To enable full query text including parameters:
- For MySQL, configure Alloy:
database_observability.mysql "default" {
  query_samples {
    disable_query_redaction = true
  }
}- For PostgreSQL, configure Alloy:
database_observability.postgres "default" {
  query_samples {
    disable_query_redaction = true
  }
}
Warning
Disabling redaction exposes actual query parameters in logs. Only enable this in environments where parameter values don’t contain sensitive data, or ensure appropriate access controls are in place.
Configure sample collection
You can adjust how query samples are collected, including collection intervals, query redaction settings, and which users to exclude. For all configuration options, refer to Tune Alloy collection.
Related documentation
- Understand wait events: Interpret wait event data
- Analyze explain plans: Understand query execution
- Tune Alloy collection: Configure sample collection
- Find application queries: Correlate with traces
- Troubleshoot: Resolve setup and configuration issues


