Analyze explain plans
Explain plans show how the database executes your queries, including which indexes are used, join strategies, and estimated costs. Use this information to identify performance bottlenecks and optimization opportunities.
An explain plan describes the database’s query execution strategy:
- Access methods: How the database reads data (index scan, table scan)
- Join strategies: How tables are combined (nested loop, hash join, merge join)
- Cost estimates: Relative expense of each operation
- Row estimates: Expected number of rows processed at each step
- Sort operations: When and how data is sorted
- Filter conditions: Where row filtering occurs
Access explain plans
To view an explain plan in Database Observability:
- Navigate to Database Observability in Grafana Cloud.
- In the Queries Overview, click a query to open its details.
- Select the Explain Plan tab.
- View the visual graph representation of the execution plan.
Note
Explain plans are only available for SELECT queries. Write operations like INSERT, UPDATE, or DELETE, and non-query operations like COMMIT, SET, or VACUUM cannot be explained.
Understand the visual graph
Database Observability displays explain plans as an interactive visual graph where each operation appears as a node connected by directed edges showing data flow.
Graph navigation
Use these controls to navigate complex explain plans:
- Zoom controls: Located in the bottom-right corner for zooming in and out
- Pan: Click and drag to move around the graph
- Fit to view: Reset the view to show all nodes
- Mini-map: Appears in the bottom-left corner when the plan has more than three nodes, providing an overview and quick navigation
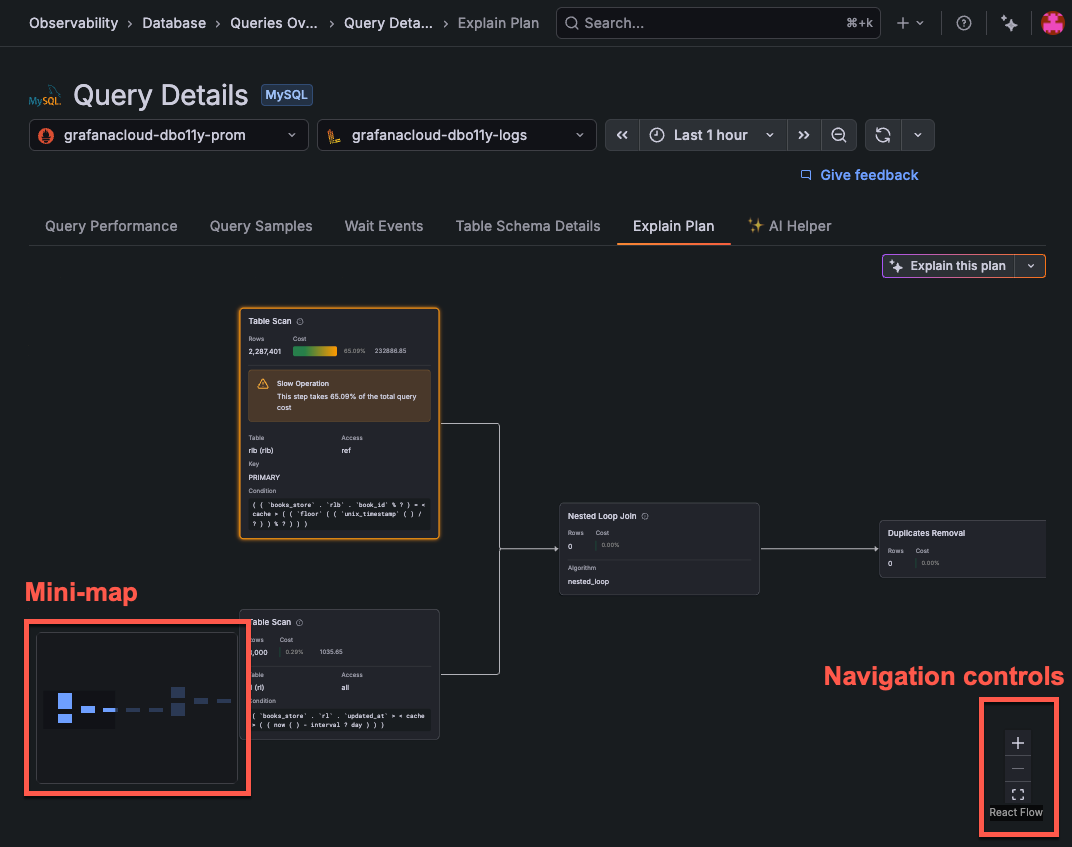
Data flows from left to right through the graph, with child operations feeding into parent operations.
Node structure
Each node in the explain plan graph contains:
Header:
- Operation name: The type of operation (for example, Table Scan, Index Scan, Hash Join, Nested Loop Join)
- Info icon: Hover to see a plain-English explanation of what the operation does
Statistics:
- Rows: Estimated number of rows returned by this operation
- Cost: A color-coded bar gauge showing the operation’s percentage of total query cost, plus the absolute cost value
Details section (when available):
Cost visualization
The cost bar gauge uses color coding to help you quickly identify expensive operations:
The absolute cost value appears next to the bar for precise comparison between operations.
Slow operation highlighting
Operations that consume 30% or more of the total query cost are automatically highlighted:
- Orange border with glow effect around the node
- Alert banner displaying: “This step takes X% of the total query cost”
Focus your optimization efforts on these highlighted operations first, as they have the greatest impact on overall query performance.
PostgreSQL operations
PostgreSQL explain plans use specific terminology for access methods and operations. The following operations appear as node titles in the visual graph.
Scan types
When table scans indicate problems
A table scan (sequential scan) isn’t always bad. Consider these factors:
Join types
Other operations
MySQL operations
MySQL explain plans have different terminology and focus on access types. The following information appears in the node details.
Access types
MySQL indicates the access method in the Access field, from best to worst:
Watch for warning values
Watch for these values in the Warning field:
Common patterns and fixes
Use these patterns to identify and address common plan issues.
Full table scan on large table
Symptom: Table Scan (PostgreSQL) or Access type ALL (MySQL) shown on nodes with high row counts.
Causes:
- No index on filtered columns
- Index exists but query predicate doesn’t match
- Statistics are outdated
Fixes:
- Add an index on the WHERE clause columns
- Update table statistics
- Check if functions prevent index usage (for example, applying functions to columns in WHERE clauses)
Sort operation without index
Symptom: Sort node appears in the plan, often with elevated cost.
Fix: Create an index that supports the ORDER BY clause columns.
Inefficient join order
Symptom: Large row estimates flowing through Nested Loop Join nodes shown in high cost.
Fixes:
- Ensure statistics are current on all joined tables
- Add indexes on join columns
Index not used despite existing
Possible causes:
Use explain insights for optimization
Follow this workflow when analyzing explain plans:
- Identify the most expensive operation: Look for highlighted slow operations or nodes with high cost percentages
- Check access methods: Are appropriate indexes being used? Look for Table Scan or ALL access types
- Look for warning signs: Sort operations, temporary tables, full scans
- Test changes: Add indexes or rewrite queries
- Verify improvement: Compare before and after explain plans
After making changes, measure optimization impact:
- Re-run the query and view the new explain plan
- Compare cost percentages (should be lower for previously expensive operations)
- Monitor actual performance in Database Observability
- Check the Query Performance tab for duration changes
Troubleshooting
Use these checks to resolve common issues when you view explain plans.
Explain plan not available
If the Explain Plan tab shows no data or an error:
- Check permissions: The monitoring user needs SELECT permissions on the tables referenced in the query
- Verify query syntax: Some complex queries may fail to generate explain plans
- Check Alloy logs: Look for explain plan collection errors
Plan doesn’t match actual performance
Explain plans show estimates, not actual execution times. The estimates can be inaccurate when:
- Table statistics are outdated
- Data distribution is skewed
- Parameter values affect cardinality
Update table statistics regularly to improve estimate accuracy.
Related documentation
- Examine query samples: See actual query executions
- Understand wait events: Identify resource bottlenecks
- Improve slow queries: Complete optimization workflow
- Troubleshoot explain plans: Resolve explain plan issues


