Troubleshoot an SLO breach with Grafana Cloud Knowledge Graph
This topic show you how to interpret an error budget burn down chart and use the knowledge graph to troubleshoot an SLO breach.
Before you begin
Before you begin, ensure that you have defined a knowledge graph SLO.
Steps
To use the knowledge graph to troubleshoot an SLO breach, perform the following steps:
Sign in to Grafana and select Observability > Health target.
Expand Objective for the SLO you want to investigate.
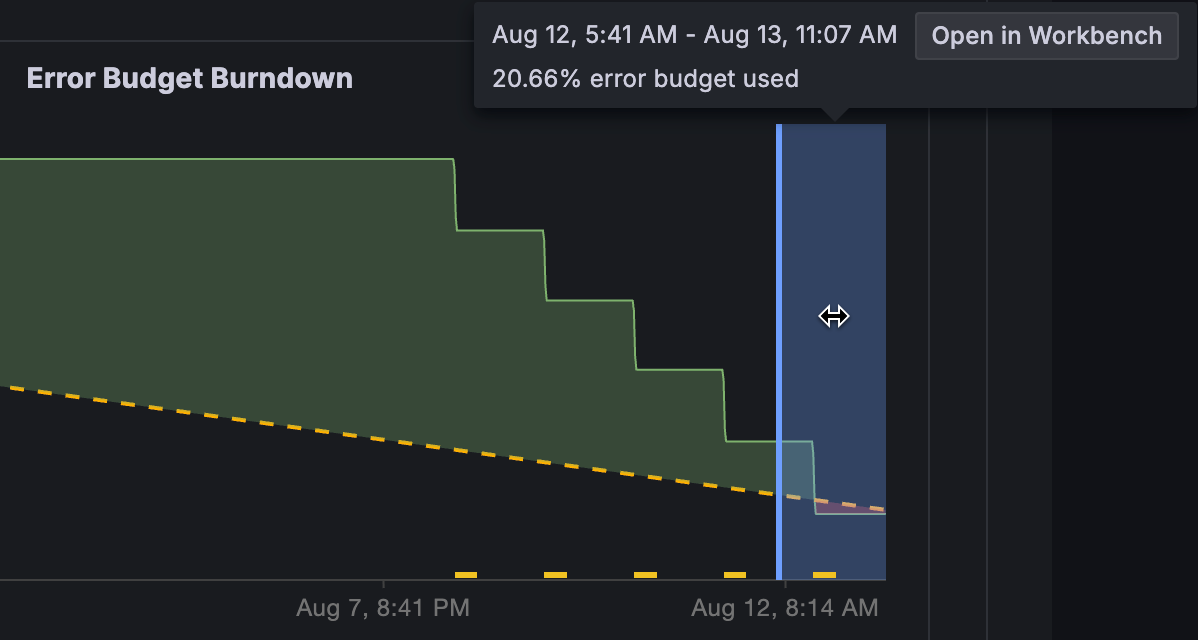
Use the following table to interpret the Error Budget Burndown panel.
![Error Budget Burndown panel showing an overview of an SLO]()
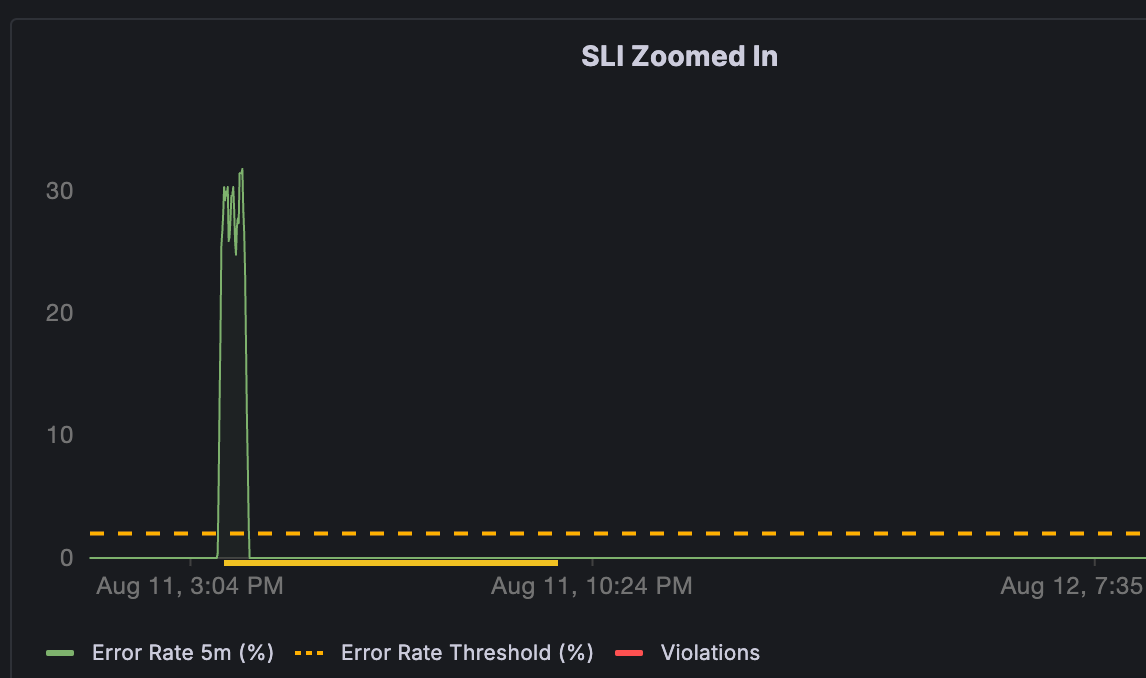
Scroll down the page and review the SLI Zoomed In panel.
In this example, you can see a large spike in error budget usage.
![SLI chart showing spike in error budget usage]()
In the Error Budget Burndown panel, click and drag your cursor to select the time range you want to investigate and click Open in RCA workbench.
The Open in RCA workbench button appears after you have added a search expression in the RCA workbench Context section while creating the SLO.
![Error Budget Burndown panel showing selected time range]()
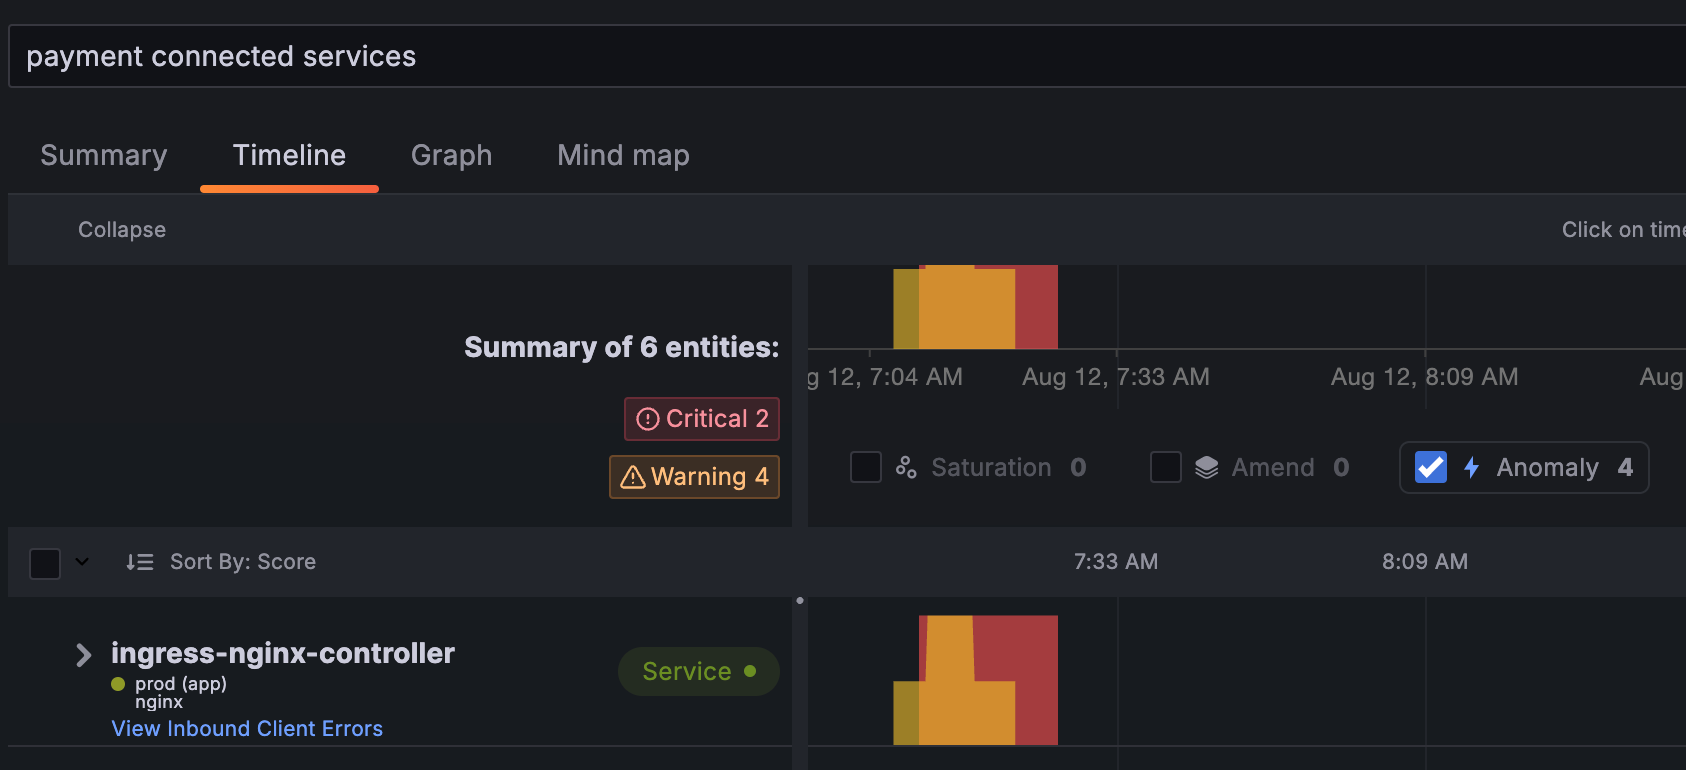
Use RCA workbench to explore entities and insights.
For more information about RCA workbench, refer to Perform root cause analysis in RCA workbench.
![RCA workbench showing services related to an SLO breach]()

Used in these workflows
Troubleshooting SLO breaches is used in:
- Monitor services - Detect when service-level objectives are being violated and take corrective action
- Investigate incidents - Understand the root cause of SLO breaches by analyzing error budget burn and related entities


