Get started with Asserts
Asserts is a next-generation technology that provides valuable insights into your distributed, multi-cloud, hybrid applications. By using Asserts, your team can eliminate the frustration of using disjointed dashboards that fail to keep up with frequent updates. Your engineers no longer need to spend time deciphering visualizations to find crucial information.
Asserts only supports Prometheus metrics for generating insights.
Note
Asserts generates an additional set of metrics to map relationships between entities. These metrics count towards your usage and bill for this stack and are estimated to increase Grafana Mimir storage by about 5%. At any time, you can disable Asserts or edit your data configuration to exclude clusters or namespaces. For more information about pricing, refer to Understand your Grafana Cloud Metrics invoice.
You can self-onboard with Asserts if you meet the following conditions:
- You have less than 5 million active series.
- Your system is sending Kubernetes metrics to Grafana Cloud. For information about which Kubernetes metrics Asserts requires, refer to Grafana Cloud Asserts prerequisites and troubleshooting
- Your system is sending RED metrics to Grafana Cloud.
If you don’t meet the preceding conditions, submit a support ticket and Grafana Labs Technical Support can help get you started.
About the getting started process
During the getting started process, you choose an environment label and, if applicable, a site label. These labels are used to scope your exploration and troubleshooting. For example, you can quickly filter to include only site: us-central-0
and env: prod
when troubleshooting a region-specific issue.
Environment label: The environment label corresponds to one or more environments that contain Prometheus metrics data stored in Grafana Cloud. The environment label populates the list of environments you can select on each Asserts page.
If you are using Kubernetes, the environment label is most likely
cluster
. However, if you have a different label that maps to your environment, you can select that label.Environments: By default, Asserts selects
All
environments, but you can exclude one or more environments.Site label: If you have selected a different Prometheus environment label, the site label defaults to
cluster
. The site label populates the list of sites you can select on each Asserts page.Sites: An environment can contain multiple sites. The Sites drop-down defaults to
All
and you can choose to exclude one or more sites.
The following image shows the Env
and site
drop-down lists in the Asserts Entity Explorer:
Example metric
In the following example metric, environment="dev"
maps to the an environment and cluster="company-abc-infra-dev-euw2-eu-west-2-eks"
maps to a site in Asserts.
http_server_duration_bucket{cluster="company-abc-infra-dev-euw2-eu-west-2-eks",environment="dev",,container="support",instance="XXX.XX.XX.XXX:8000",job="support-support-svc-metrics",le="5",namespace="support", service="support-support-svc-metrics"}
However, if you do not have a special environment
label, select cluster
as your environment label.
Before you begin
Before you begin the Asserts get started process, ensure the following:
- You are sending Prometheus metrics to Grafana Cloud
- You are familiar with your metrics coming into Grafana Cloud, including the source environment and clusters
- You have Grafana Cloud Admin permissions
Steps
Complete the following steps to get started with Asserts:
Sign into Grafana Cloud and click Asserts.
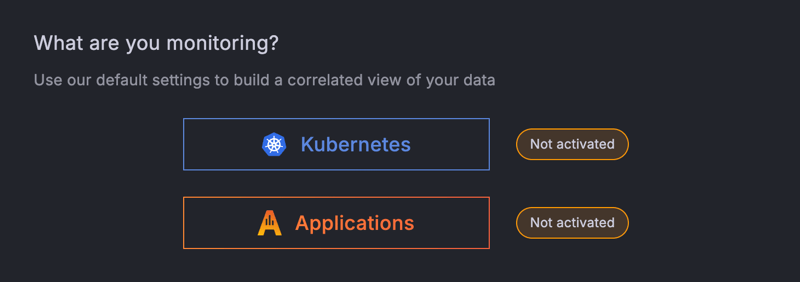
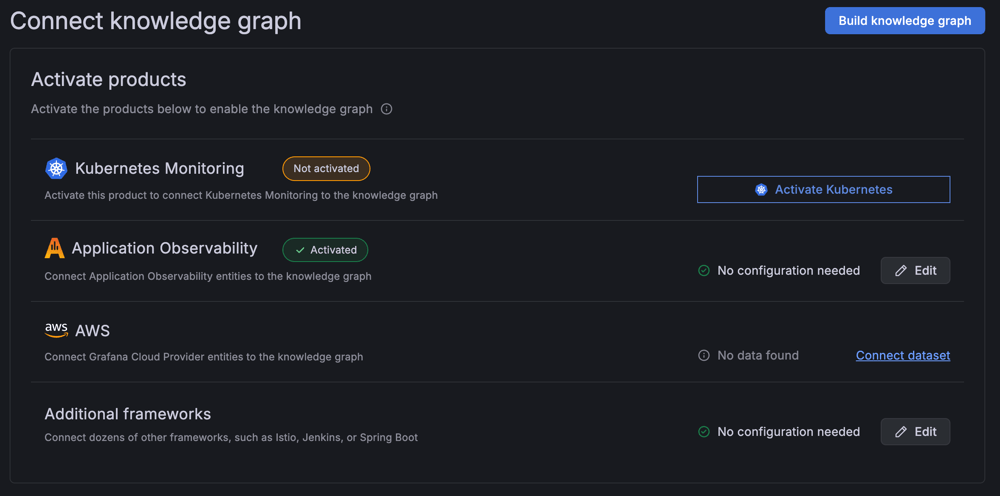
Click Get started.
Complete the following fields:
Field Description Environment label Select the source environment you want to monitor with Asserts. Environments Deselect the environments you want to exclude from Asserts. Site label Optional. If you have selected a different Prometheus environment label, site label defaults to cluster
. You can select a different site label, as required.Sites Deselect the sites you want to exclude from Asserts. If you want to filter which metrics Asserts processes, complete the following steps:
Select the Add filters toggle and click Add filter.
Populate the fields with filter values and an operator.
You can add multiple filters.
In the Select frameworks field, select one or more software development frameworks.
Click Test & Save configuration.
If you are using a Grafana integration, Asserts automatically updates the integration to support Asserts dashboards.
If you’ve activated Asserts and don’t see entities being discovered, refer to the troubleshooting guide.