Configure Node exporter to generate Prometheus metrics
To configure nodes to generate Prometheus metrics, install the Node Exporter.
Metrics and KPIs
| Metric | KPI |
|---|---|
CPU node_cpu_seconds_total | 1 - avg by(instance, job)(rate(node_cpu_seconds_total{mode=“idle”}[5m])) |
Memory node_memory_MemTotal_bytes node_memory_Buffers_bytes node_memory_Cached_bytes node_memory_MemFree_bytes node_memory_Slab_bytes node_vmstat_pgmajfault | Memory Utilization 1 - (buffer + cached + free + slab)/total Page Fault Rate rate(node_vmstat_pgmajfault[1m]) |
Network Bytes node_network_receive_bytes_total node_network_transmit_bytes_total | Network Byte Rate rate(node_network_receive_bytes_total[5m]) rate(node_network_transmit_bytes_total[5m]) |
Disk node_filesystem_avail_bytes node_filesystem_size_bytes Read/Write byte rate node_disk_read_bytes_total node_disk_written_bytes_total Read Time and Count node_disk_read_time_seconds_total node_disk_reads_completed_total Write Time and Count node_disk_write_time_seconds_total node_disk_writes_completed_total | Disk Utilization 1 - available bytes / size bytes Disk IO Rate rate(node_disk_read_bytes_total[5m]) rate(node_disk_written_bytes_total[5m]) Disk Average Latency rate(…time_seconds_total[5m]) / rate(…_completed_total[5m]) |
Alerts
| KPI | Alert |
|---|---|
Memory Utilization High Memory Page Faults | Saturation with resource_type=memory:utilization Saturation with resource_type=memory:page_fault |
| CPU Utilization | Saturation |
| Network Bytes Rate | ResourceRateAnomaly |
| Disk Utilization | Saturation |
| Disk Read/Write Rate | ResourceRateAnomaly |
| Disk Read/Write Latency Average | Saturation when latency average breaches 100ms |
Dashboard
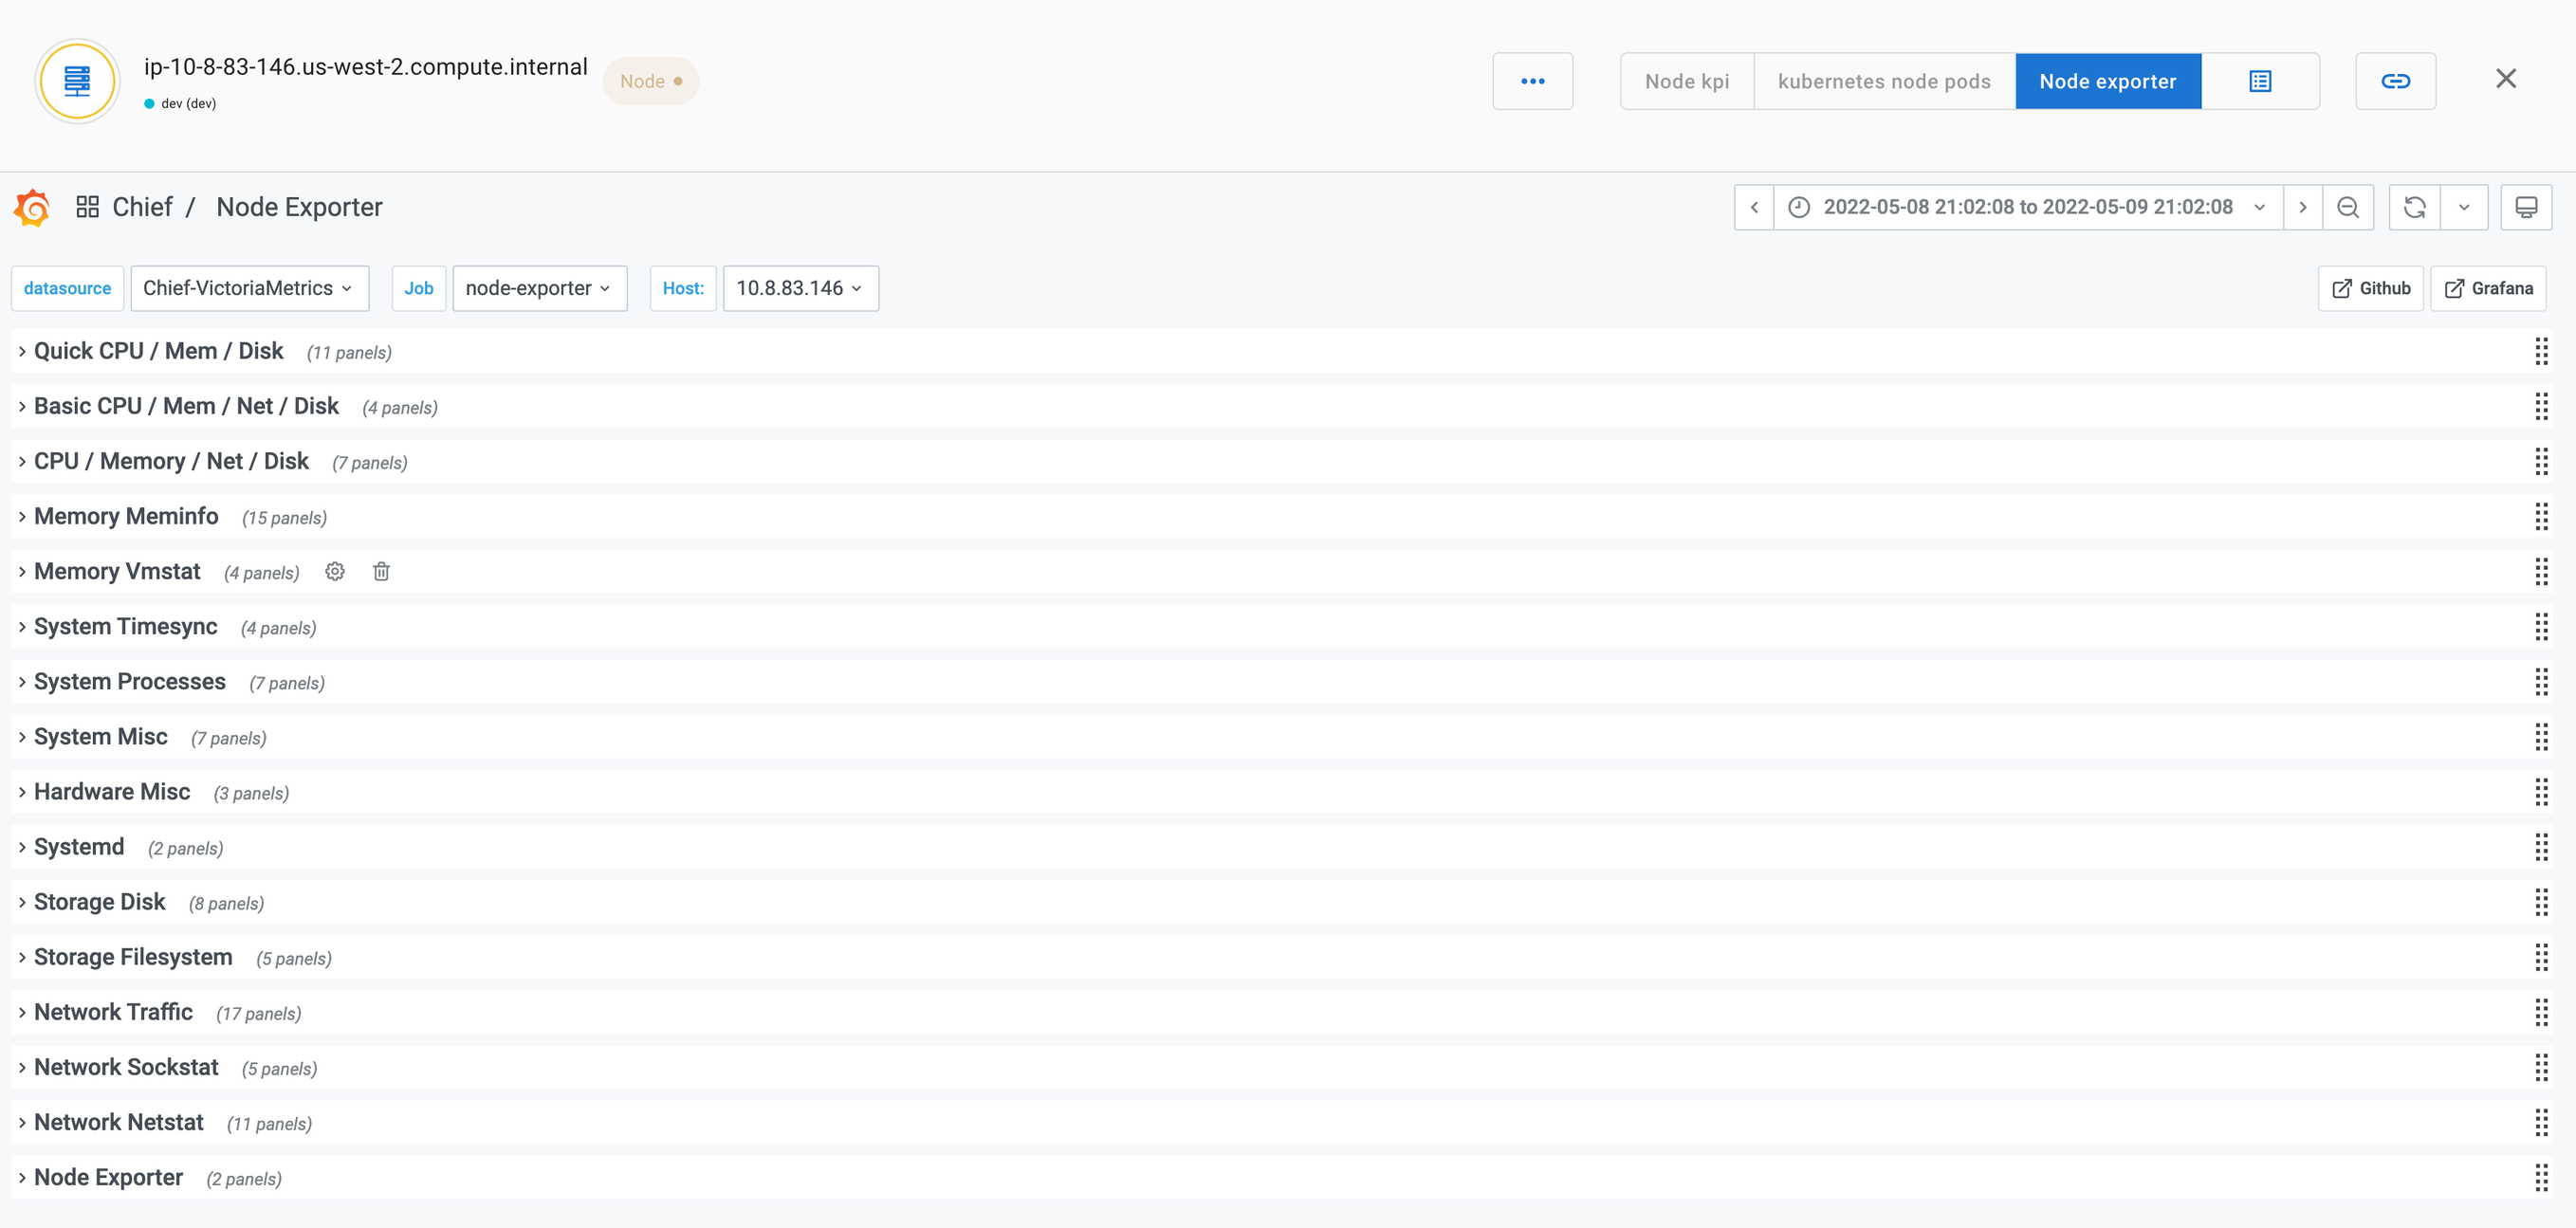
The following dashboard shows Node KPIs.

Was this page helpful?
Related resources from Grafana Labs


