Configure remote_write with Helm and kube-prometheus-stack
You can configure Prometheus’s remote_write feature to send cluster metrics to Grafana Cloud using Helm and kube-prometheus-stack. The kube-prometheus-stack Helm chart installs the kube-prometheus stack. The kube-prometheus stack configures Prometheus Operator with a default Prometheus-Alertmanager-Grafana stack, and sets up preconfigured Alertmanager alerts. It also configures a set of Prometheus scrape targets, and sets up node-exporter and kube-state-metrics. Prometheus Operator is a sub-component of the kube-prometheus stack.
Prometheus Operator implements the Kubernetes Operator pattern for managing a Prometheus-based Kubernetes monitoring stack. A Kubernetes Operator consists of Kubernetes custom resources and controller code that abstract away the management and implementation details of running a given service on Kubernetes. For more about Kubernetes Operators, refer to Operator pattern from the Kubernetes docs.
The Prometheus Operator provides a set of Kubernetes Custom Resources that simplify Prometheus, Grafana and Alertmanager deployment and configuration. For example, using the ServiceMonitor custom resource, you can configure how to monitor groups of Kubernetes services in YAML manifests. The Operator controller then communicates with the Kubernetes API server to monitor service endpoints and automatically generate the required Prometheus scrape configurations for the configured services. For more about Prometheus Operator, refer to the Prometheus Operator GitHub repository.
Before you begin
You must have installed kube-prometheus-stack in your Kubernetes cluster using the Helm package manager.
- To install Helm on your local machine, refer to Install Helm
- To install kube-prometheus-stack, refer to Install Chart.
If you did not use Helm to install kube-prometheus, refer to Configure remote_write with Prometheus Operator.
Create a Kubernetes Secret to store Grafana Cloud credentials
Create a Kubernetes Secret to store your Grafana Cloud Metrics username and password.
To find your username, navigate to your stack in the Cloud Portal, and click Details next to the Prometheus panel.
Your password corresponds to a Cloud Access Policy token that you can generate by clicking on Generate now in this same panel. To create a Cloud Access Policy, refer to Create a Grafana Cloud Access Policy.
Note your Cloud Prometheus username and password.
Run the following command to create a Secret, as in this example
kubepromsecret:kubectl create secret generic kubepromsecret \ --from-literal=username=<your_grafana_cloud_prometheus_username>\ --from-literal=password='<your_grafana_cloud_access_policy_token>'\ -n defaultNote: If you deployed your monitoring stack in a namespace other than
default, change the-n defaultflag to the appropriate namespace in the above command. For more about this command, refer to Managing Secrets using kubectl.kubectl create secret generic kubepromsecret \ --from-literal=username=<your_grafana_cloud_prometheus_username>\ --from-literal=password='<your_grafana_cloud_access_policy_token>'\ -n defaultInstead of creating the secret directly as in this example, alternatively you can use a manifest file. For more about Kubernetes Secrets, refer to Secrets from the Kubernetes docs.
Create a Helm values file with Prometheus remote_write configuration
Create a Helm values file to define parameters for Prometheus’s remote_write configuration. A Helm values file allows you to set configuration variables that are passed in to Helm’s object templates. To see the default values file for kube-prometheus-stack, refer to values.yaml from the kube-prometheus-stack GitHub repository.
Create a values.yaml file defining Prometheus’s remote_write configuration, and then apply the new configuration to kube-prometheus-stack.
Open a file named
new_values.yamlin an editor and paste in the following values:prometheus: prometheusSpec: remoteWrite: - url: "<Your Metrics instance remote_write endpoint>" basicAuth: username: name: kubepromsecret key: username password: name: kubepromsecret key: passwordSet the remote_write URL and basic_auth username and password using the Secret created in the previous section.
Save and close the file.
Apply the changes using the following command:
helm upgrade -f new_values.yaml [your_release_name] prometheus-community/kube-prometheus-stackReplace
[your_release_name]with the name of the release you used to install kube-prometheus-stack. You can get a list of installed releases usinghelm list.After running
helm upgrade, you should see the following output:Release "your_release_name" has been upgraded. Happy Helming! NAME: your_release_name LAST DEPLOYED: Mon Dec 7 17:29:03 2020 NAMESPACE: default STATUS: deployed REVISION: 2 NOTES: kube-prometheus-stack has been installed. Check its status by running: kubectl --namespace default get pods -l "release=your_release_name" Visit https://github.com/prometheus-operator/kube-prometheus for instructions on how to create & configure Alertmanager and Prometheus instances using the Operator.
Verify your updates
Verify that your changes have propagated to your running Prometheus instances.
Find the name of the Prometheus service. This will be in the format <your_release_name>-kube-prometheus-stack-prometheus, but could be truncated to fit naming length restrictions.
kubectl --namespace default get serviceUse port-forward with that Prometheus service by running the following command:
kubectl --namespace default port-forward svc/<prometheus service name> 9090Navigate to
http://localhost:9090in your browser, and then Status and Configuration.Verify that the
remote_writeblock you appended above has propagated to your running Prometheus instances.Navigate to Kubernetes Monitoring, and click Configuration on the main menu.
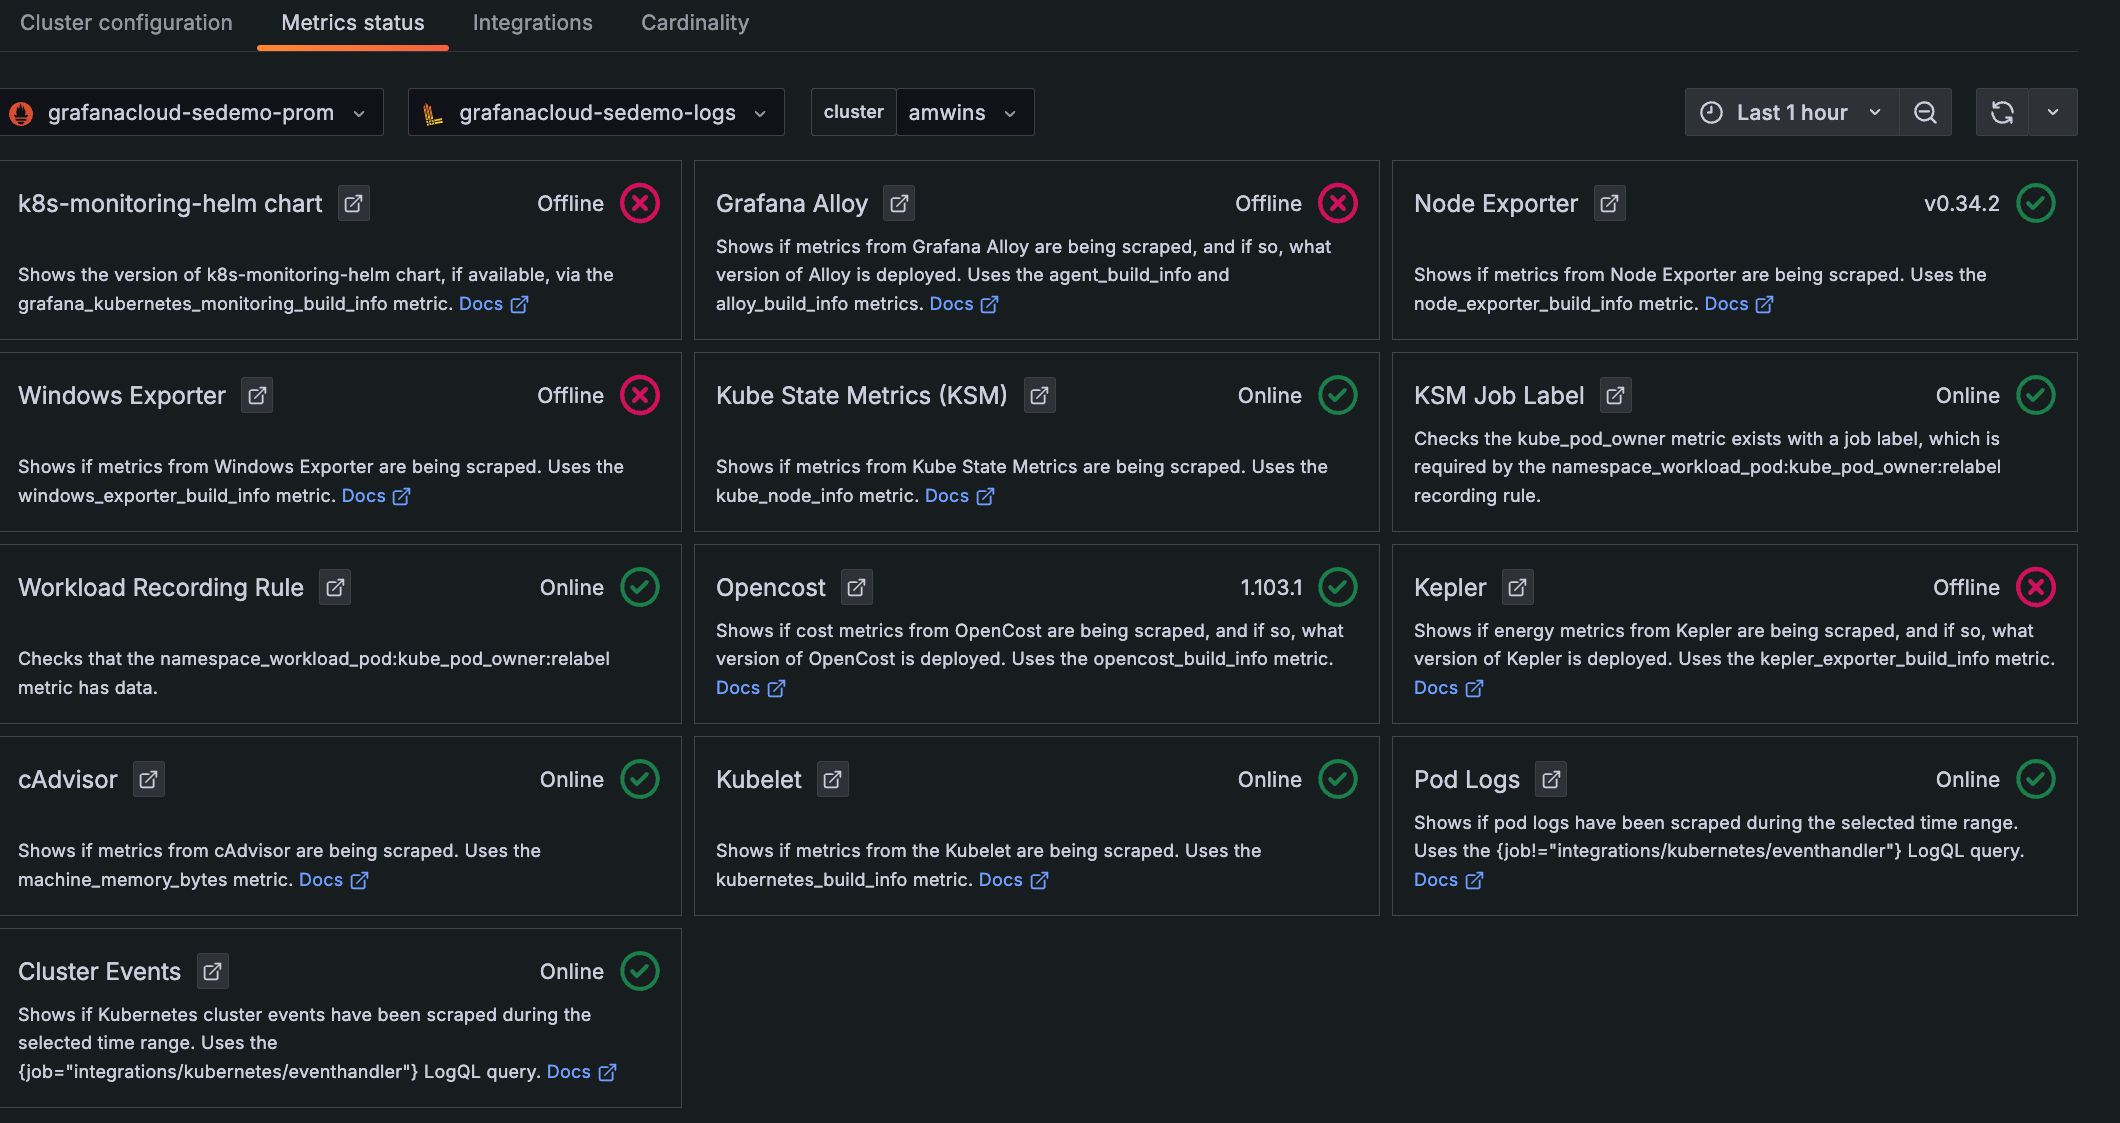
Click the Metrics status tab to view the data status. Your data begins populating in the view as the system components begin scraping and sending data to Grafana Cloud.
![**Metrics status** tab with status indicators for one Cluster Descriptions and statuses for each item chosen to be configured and whether they are online]()
Metrics status tab with status indicators for one Cluster


