Configure gRPC Go to generate Prometheus metrics
gRPC Go supports Interceptors which is middleware that gRPC Server executes before the request is passed to the user’s application logic. It is a perfect way to implement common patterns: auth, logging, and monitoring.
To use Interceptors in chains, refer to go-grpc-middleware.
This library requires Go 1.9 or later.
To configure gRPC Go to generate Prometheus metrics, complete the following steps:
Navigate to go-grpc-middleware.
Complete the steps in the README.
Verify the presence of the following metrics in Prometheus:
- grpc_server_handled_total
- grpc_server_handling_seconds_bucket
Metrics
| Metric | Key Performance Indicator(KPI) |
|---|---|
Requests grpc_server_handled_total | Request Rate rate(grpc_server_handled_total[5m]) |
Errors grpc_server_handled_total{grpc_code!=“OK”} | Error Ratio rate(grpc_server_handled_total{grpc_code!=“OK”}[5m])/ rate(grpc_server_handled_total[5m]) |
Latency grpc_server_handling_seconds_count grpc_server_handling_seconds_bucket | Latency Average rate(grpc_server_handling_seconds_count[5m])/ rate(grpc_server_handling_seconds_count[5m]) Latency P99 |
Alerts
| KPI | Alerts |
|---|---|
| Request Rate | RequestRateAnomaly |
| Error Rate | ErrorRatioBreach ErrorBuildup based on a 99.9 SLO |
Latency Average Latency P99 | LatencyAverageBreach LatencyAverageAnomaly LatencyP99ErrorBuildup |
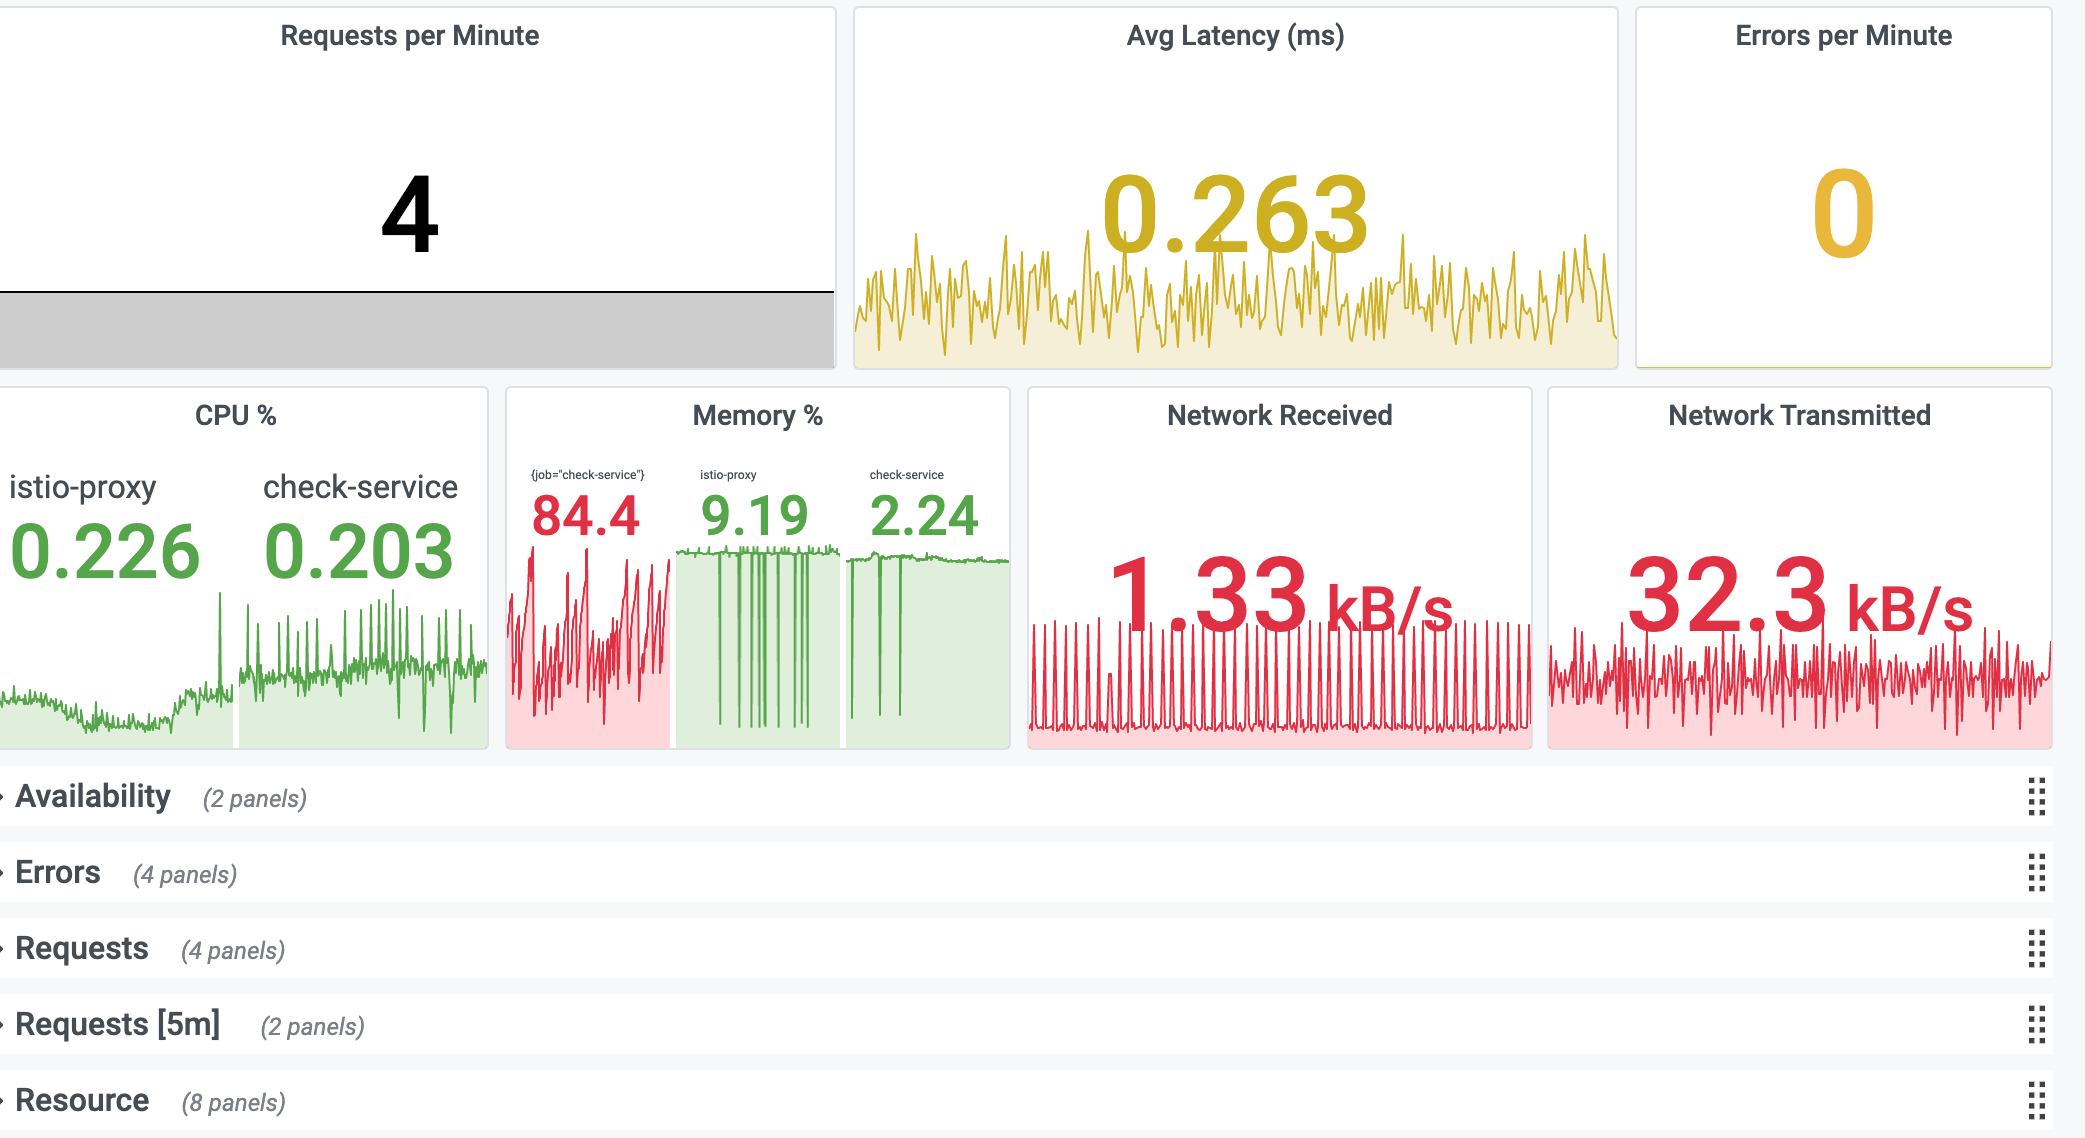
Service KPI dashboard
This dashboard has the following KPIs for resources and requests:
- Request Rate
- Latency Average
- Latency P99
- Error Rate
- CPU %
- CPU Cores Used
- CPU Throttle
- Memory %
- Memory Bytes
- Disk Usage
- Network Usage