Visualize existing observability data
Grafana Cloud runs the same open source Grafana platform deployed by thousands of DevOps and SREs, but is managed and optimized by Grafana maintainers and contributors, so you don’t have to worry about downtime, upgrades, and high-availability for your metrics visualization platform.
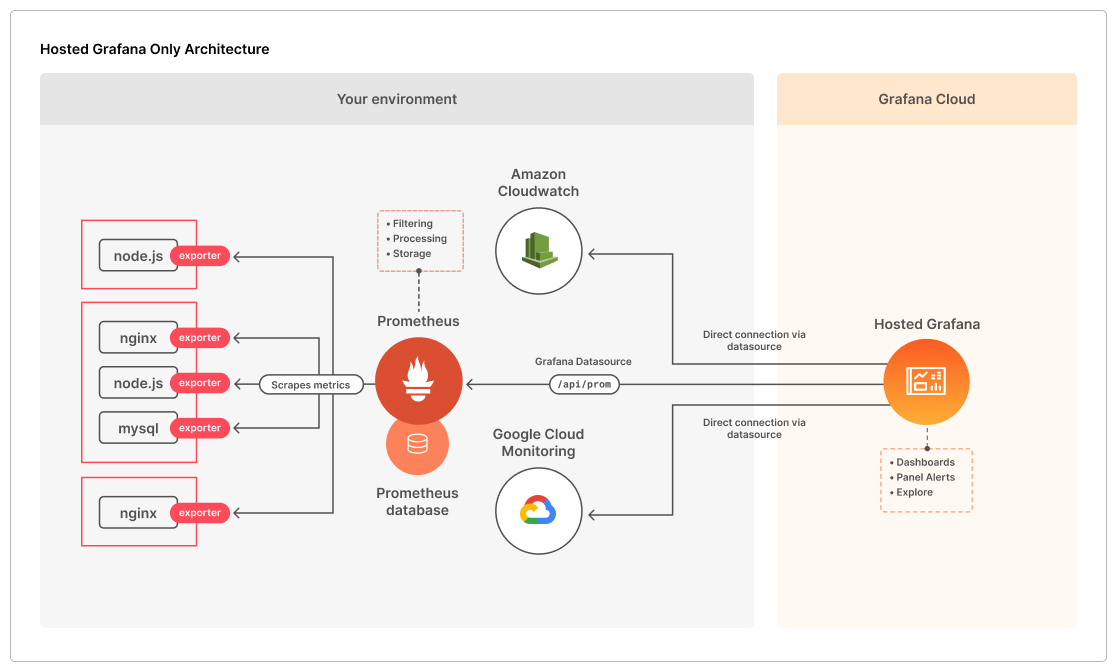
You can visualize observability metrics from existing data sources running in your environment and managed data endpoints built-in to Grafana Cloud.
Start visualizing
Plug in your data sources: Grafana natively supports many popular data sources like Prometheus, Elasticsearch, and Amazon CloudWatch, and offers plugins for many more. The Grafana plugin library contains over 40 data source plugins for many popular data stores, cloud services, and applications, all with one-click installation into Grafana Cloud. Integration with Grafana Cloud metrics and logs endpoints comes built-in and pre-configured. See the Grafana data sources documentation for details.
Import a Grafana dashboard: There are hundreds of official and community-built Grafana dashboards that you can import to get visibility into your apps and infrastructure. To learn how to import a dashboard into Grafana Cloud, please see Importing a Dashboard from the Grafana docs.
Explore your metrics data: Using PromQL, you can select and aggregate time series data in real time and visualize it in a graph or table. Grafana’s Explore view allows you to optimize and debug queries, as well as view metrics, logging, and tracing data side by side to dig into incidents and events. To learn more about using Grafana’s Explore view, please see Explore from the official Grafana docs.
Explore tracing data: Using TraceQL, a query language modeled on PromQL and LogQL, you can interactively extract insights from your trace data. You can use the Tempo data source Search and query editor to create TraceQL queries.
Note
If your network blocks network traffic by default, see Source IPs for allowlisting for a list of services to allow.
Grafana Cloud does not currently support connecting to external data sources using IPv6. You must use IPv4 for these.


