
Creating and managing folders, data sources, and dashboards using Grizzly
Learn how to add a data sources, folders and dashboard, using Grizzly.
Prerequisites
Before you begin, you should have the following available:
- A Grafana Cloud account
- An existing Grafana Cloud stack with a Grafana API Key
- Grizzly installed on your machine
Authentication Setup
To authenticate with the Grizzly API, you must create environment variables. Run the following commands to create environment variables named GRAFANA_URL and GRAFANA_TOKEN:
export GRAFANA_URL=<Grafana-instance-url>
export GRAFANA_TOKEN=<Grafana-API-Key>
Replace the following field values:
<Grafana-instance-url>with the URL of your Grafana instance.<Grafana-API-Key>with API key from the Grafana instance.
Add a data source
The following steps use the InfluxDB data source. The required arguments vary depending on the data source you select.
Create a file named
data-source.ymland add the following:apiVersion: grizzly.grafana.com/v1alpha1 kind: Datasource metadata: name: <data-source-name> spec: name: <data-source-name> type: influxdb url: <data-source-url> database: <db-name> user: <username> secureJsonData: password: '<password>' uid: <uid> id: <id> access: proxyReplace the following field values:
<data-source-name>with the name of the data source to be added in Grafana.<data-source-url>with URL of your data source.<username>with the username for authenticating with your data source.<password>with the password for authenticating with your data source.<db-name>with name of your database.<id>with the ID for your data source in Grafana.<uid>wth the UID for your data source in Grafana.
Add a folder
The following YAML definition creates a folder in your Grafana instance.
Create a file named
folder.ymland add the following:apiVersion: grizzly.grafana.com/v1alpha1 kind: DashboardFolder metadata: name: <folder-name> spec: title: <folder-name> uid: <uid>Replace the following field values:
<folder-name>with the name of the folder to be added in Grafana.<uid>with the UID for your folder in Grafana.
Add a dashboard to the folder
Use the following YAML definition to create a simple dashboard in the Grafana instance folder from the previous step. To add more than a title and UID to the dashboard, you can convert your dashboard JSON config to YAML and paste it under spec.
Create a file named
dashboard.ymland add the following:apiVersion: grizzly.grafana.com/v1alpha1 kind: Dashboard metadata: folder: <folder-name> name: influxdb-cloud-demos spec: title: InfluxDB Cloud Demos uid: influxdb-cloud-demosReplace the following field values:
<folder-name>with the name of the folder created in the previous step.
Using Grizzly CLI
In a terminal, run the following commands from the directory where all of the YAML definitions are located.
Add the data source.
grr apply data-source.ymlAdd a folder.
grr apply folder.ymlAdd a dashboard to the folder.
grr apply dashboard.yml
Validation
Once you apply the configurations using the Grizzly CLI, you should be able to verify the following:
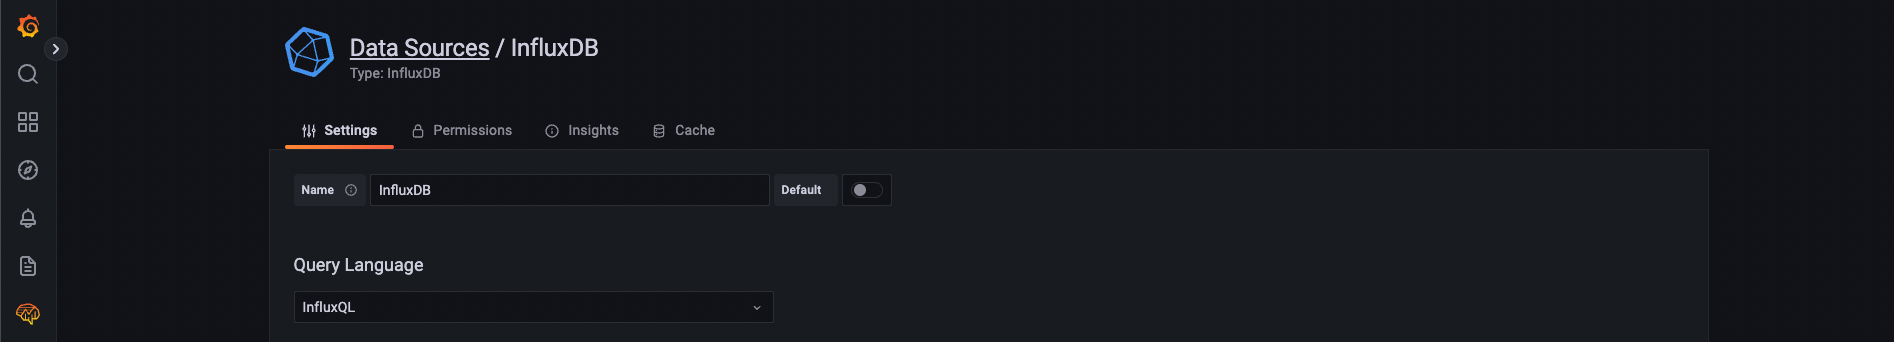
A new data source (InfluxDB in this example) is visible in Grafana.
![InfluxDB datasource]()
A new dashboard and folder in Grafana. In the following image a dashboard named
InfluxDB Cloud Demoswas created inside theDemosfolder.![InfluxDB dashboard]()

Conclusion
In this guide, you created a data source, folder, and dashboard using Grizzly.
To learn more about managing Grafana using Grizzly, see the Grizzly documentation.


