Manage folders, data sources, and dashboards using the Grafana Operator
This guide shows you how to manage data sources, folders, and dashboards using the Grafana Operator. You’ll create these resources declaratively using Kubernetes custom resources.
Prerequisites
Before you begin, make sure you have the following:
- An existing Grafana Cloud stack
- Grafana Operator installed in your cluster, as shown in Grafana Operator Installation
Set up the Grafana Operator
The Grafana Operator allows you to authenticate with your Grafana instance using the Grafana Custom Resource (CR).
Create the Grafana API Token Secret
Store the Grafana API Token in a secret with the following content in a file named grafana-token.yml:
apiVersion: v1
kind: Secret
metadata:
  name: grafana-cloud-credentials
  namespace: '<GRAFANA_OPERATOR_NAMESPACE>'
stringData:
  GRAFANA_CLOUD_INSTANCE_TOKEN: '<GRAFANA_API_KEY>'
type: Opaque
Replace the placeholders with your values:
<GRAFANA_API_KEY>: API key from your Grafana instance. To create an API key, refer to Grafana API Key Documentation<GRAFANA_OPERATOR_NAMESPACE>: Namespace where thegrafana-operatoris deployed in your Kubernetes cluster
Configure the Grafana Custom Resource
Set up connection to your Grafana Cloud instance. Create a file named grafana-cloud.yml:
apiVersion: grafana.integreatly.org/v1beta1
kind: Grafana
metadata:
  name: '<GRAFANA_CLOUD_STACK_NAME>'
  namespace: '<GRAFANA_OPERATOR_NAMESPACE>'
  labels:
    dashboards: '<GRAFANA_CLOUD_STACK_NAME>'
spec:
  external:
    url: https://<GRAFANA_CLOUD_STACK_NAME>.grafana.net/
    apiKey:
      name: grafana-cloud-credentials
      key: GRAFANA_CLOUD_INSTANCE_TOKEN
Replace the placeholders with your values:
<GRAFANA_CLOUD_STACK_NAME>: Name of your Grafana Cloud stack<GRAFANA_OPERATOR_NAMESPACE>: Namespace where thegrafana-operatoris deployed in your Kubernetes cluster
Add a data source
Note
This example uses the Prometheus data source. Note that the required arguments vary depending on the data source you select.
Create a data source configuration
Create and save a new YAML file datasource.yml with your data source’s configuration:
apiVersion: grafana.integreatly.org/v1beta1
kind: GrafanaDatasource
metadata:
  name: '<DATA_SOURCE_NAME>'
  namespace: '<GRAFANA_OPERATOR_NAMESPACE>'
spec:
  instanceSelector:
    matchLabels:
      dashboards: '<GRAFANA_CLOUD_STACK_NAME>'
  allowCrossNamespaceImport: true
  datasource:
    access: proxy
    database: prometheus
    jsonData:
      timeInterval: 5s
      tlsSkipVerify: true
    name: '<DATA_SOURCE_NAME>'
    type: prometheus
    url: '<DATA_SOURCE_URL>'
Replace the placeholders with your values:
<DATA_SOURCE_NAME>: Name of the data source to be added in Grafana<DATA_SOURCE_URL>: URL of your data source<GRAFANA_CLOUD_STACK_NAME>: Name of your Grafana Cloud stack<GRAFANA_OPERATOR_NAMESPACE>: Namespace where thegrafana-operatoris deployed in your Kubernetes cluster
Add a dashboard to a folder
Use the following YAML definition to create a simple dashboard in the Grafana instance under a custom folder. If the folder defined under the spec.folder field doesn’t exist, the operator creates it before placing the dashboard inside the folder.
Prepare the dashboard configuration. In dashboard.yml, define the dashboard and assign it to a folder:
apiVersion: grafana.integreatly.org/v1beta1
kind: GrafanaDashboard
metadata:
  name: '<FOLDER_NAME>'
  namespace: '<GRAFANA_OPERATOR_NAMESPACE>'
spec:
  instanceSelector:
    matchLabels:
      dashboards: '<GRAFANA_CLOUD_STACK_NAME>'
  folder: '<FOLDER_NAME>'
  json: >
    {
      "title": "as-code dashboard",
      "uid" : "ascode"
    }
Replace the placeholders with your values:
<FOLDER_NAME>: Name of the folder in which you want the dashboard to be created<GRAFANA_CLOUD_STACK_NAME>: Name of your Grafana Cloud stack<GRAFANA_OPERATOR_NAMESPACE>: Namespace where thegrafana-operatoris deployed in your Kubernetes cluster
Apply the Kubernetes manifests
In a terminal, run the following commands from the directory where all of the above Kubernetes YAML definitions are located.
Create Kubernetes Custom resources for all of the configurations:
kubectl apply -f grafana-token.yml grafana-cloud.yml datasource.yml dashboard.ymlValidate your configuration
After you apply the configurations, verify that:
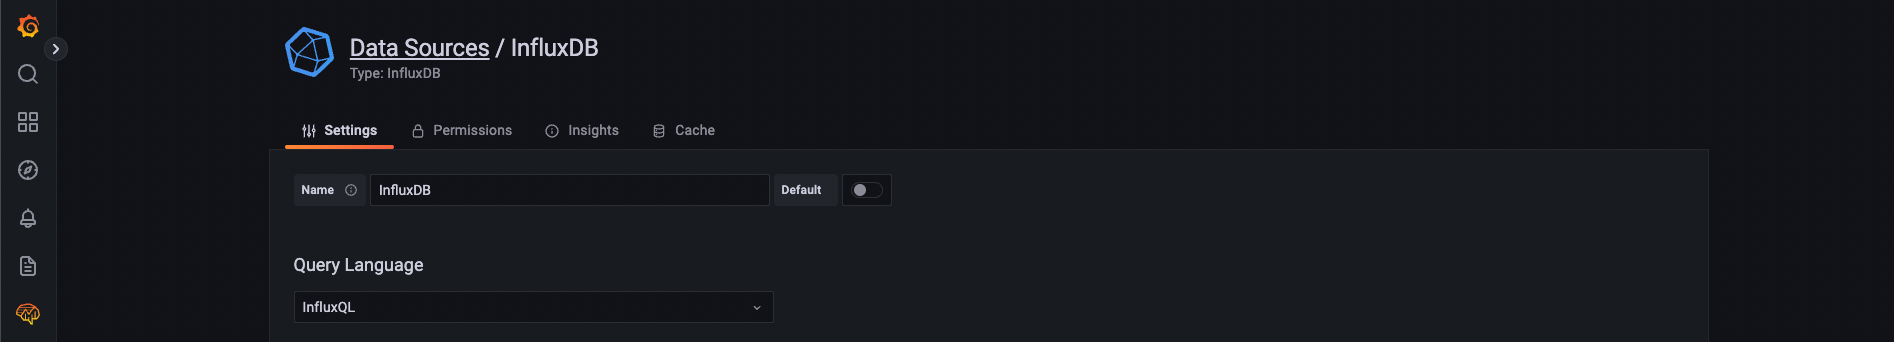
A new data source is visible in Grafana. In the following image, a data source named
InfluxDBwas created.![InfluxDB datasource]()
A new dashboard and folder have been created in Grafana. In the following image, a dashboard named
InfluxDB Cloud Demoswas created inside theDemosfolder.![InfluxDB dashboard]()

Next steps
You’ve successfully created a data source, folder, and dashboard using the Grafana Operator. Your Grafana resources are now managed declaratively through Kubernetes custom resources.
To learn more about managing Grafana:


