TensorFlow Serving integration for Grafana Cloud
TensorFlow Serving is an end-to-end open source platform for machine learning. The TensorFlow Serving integration uses Grafana Alloy to collect metrics for monitoring a TensorFlow Serving instance, including aspects such as model request latency, model runtime latency, batch queuing latency, graph build time, and graph run time. The integration also supports the TensorFlow Serving Docker container logs being scraped by Alloy using Promtail. An accompanying dashboard is provided to visualize these metrics and logs.
This integration supports TensorFlow Serving 2.10.0+.
This integration includes 2 useful alerts and 1 pre-built dashboard to help monitor and visualize TensorFlow Serving metrics and logs.
Before you begin
In order for the integration to work, you must configure TensorFlow Serving’s built in Prometheus metrics server.
It is required to first enable the Prometheus metrics as described in the TensorFlow Serving documentation.
Special configuration is also needed in order to enable the the Prometheus batching metrics. Batching configuration can be enabled as described in the TensorFlow Serving documentation.
Install TensorFlow Serving integration for Grafana Cloud
- In your Grafana Cloud stack, click Connections in the left-hand menu.
- Find TensorFlow Serving and click its tile to open the integration.
- Review the prerequisites in the Configuration Details tab and set up Grafana Alloy to send TensorFlow Serving metrics and logs to your Grafana Cloud instance.
- Click Install to add this integration’s pre-built dashboard and alerts to your Grafana Cloud instance, and you can start monitoring your TensorFlow Serving setup.
Configuration snippets for Grafana Alloy
Simple mode
These snippets are configured to scrape a single TensorFlow Serving instance running locally with default ports.
First, manually copy and append the following snippets into your alloy configuration file.
Metrics snippets
discovery.relabel "metrics_integrations_integrations_tensorflow" {
	targets = [{
		__address__ = "localhost:8501",
	}]

	rule {
		target_label = "instance"
		replacement  = constants.hostname
	}
}

prometheus.scrape "metrics_integrations_integrations_tensorflow" {
	targets      = discovery.relabel.metrics_integrations_integrations_tensorflow.output
	forward_to   = [prometheus.remote_write.metrics_service.receiver]
	job_name     = "integrations/tensorflow"
	metrics_path = "/monitoring/prometheus/metrics"
}
Logs snippets
linux
discovery.docker "logs_integrations_integrations_tensorflow" {
	host             = "unix:///var/run/docker.sock"
	refresh_interval = "5s"

	filter {
		name   = "name"
		values = ["tensorflow"]
	}
}

discovery.relabel "logs_integrations_integrations_tensorflow" {
	targets = []

	rule {
		source_labels = ["__meta_docker_container_name"]
		target_label  = "name"
		replacement   = "tensorflow"
	}

	rule {
		source_labels = ["__meta_docker_container_name"]
		target_label  = "job"
		replacement   = "integrations/tensorflow"
	}

	rule {
		source_labels = ["__meta_docker_container_name"]
		target_label  = "instance"
		replacement   = constants.hostname
	}
}

loki.source.docker "logs_integrations_integrations_tensorflow" {
	host             = "unix:///var/run/docker.sock"
	targets          = discovery.docker.logs_integrations_integrations_tensorflow.targets
	forward_to       = [loki.write.grafana_cloud_loki.receiver]
	relabel_rules    = discovery.relabel.logs_integrations_integrations_tensorflow.rules
	refresh_interval = "5s"
}
Advanced mode
The following snippets provide examples to guide you through the configuration process.
To instruct Grafana Alloy to scrape your TensorFlow Serving instances, manually copy and append the snippets to your alloy configuration file, then follow subsequent instructions.
Advanced metrics snippets
discovery.relabel "metrics_integrations_integrations_tensorflow" {
	targets = [{
		__address__ = "localhost:8501",
	}]

	rule {
		target_label = "instance"
		replacement  = constants.hostname
	}
}

prometheus.scrape "metrics_integrations_integrations_tensorflow" {
	targets      = discovery.relabel.metrics_integrations_integrations_tensorflow.output
	forward_to   = [prometheus.remote_write.metrics_service.receiver]
	job_name     = "integrations/tensorflow"
	metrics_path = "/monitoring/prometheus/metrics"
}
To monitor your TensorFlow Serving instance, you must use a discovery.relabel component to discover your TensorFlow Serving Prometheus endpoint and apply appropriate labels, followed by a prometheus.scrape component to scrape it.
Configure the following properties within each discovery.relabel component:
__address__: The address to your TensorFlow Serving Prometheus metrics endpoint.instancelabel:constants.hostnamesets theinstancelabel to your Grafana Alloy server hostname. If that is not suitable, change it to a value uniquely identifies this TensorFlow Serving instance. Make sure this label value is the same for all telemetry data collected for this instance.
If you have multiple TensorFlow Serving servers to scrape, configure one discovery.relabel for each and scrape them by including each under targets within the prometheus.scrape component.
Advanced logs snippets
linux
discovery.docker "logs_integrations_integrations_tensorflow" {
	host             = "unix:///var/run/docker.sock"
	refresh_interval = "5s"

	filter {
		name   = "name"
		values = ["tensorflow"]
	}
}

discovery.relabel "logs_integrations_integrations_tensorflow" {
	targets = []

	rule {
		source_labels = ["__meta_docker_container_name"]
		target_label  = "name"
		replacement   = "tensorflow"
	}

	rule {
		source_labels = ["__meta_docker_container_name"]
		target_label  = "job"
		replacement   = "integrations/tensorflow"
	}

	rule {
		source_labels = ["__meta_docker_container_name"]
		target_label  = "instance"
		replacement   = constants.hostname
	}
}

loki.source.docker "logs_integrations_integrations_tensorflow" {
	host             = "unix:///var/run/docker.sock"
	targets          = discovery.docker.logs_integrations_integrations_tensorflow.targets
	forward_to       = [loki.write.grafana_cloud_loki.receiver]
	relabel_rules    = discovery.relabel.logs_integrations_integrations_tensorflow.rules
	refresh_interval = "5s"
}
To monitor your TensorFlow Serving instance logs, you will use a combination of the following components:
- discovery.docker discovers docker containers. Make sure to match the filters to your environment.
- loki.source.docker reads log entries from Docker containers.
- discovery.relabel defines any relabeling needed before sending logs to Loki.
Kubernetes instructions
Before you begin with Kubernetes
Please note: These instructions assume the use of the Kubernetes Monitoring Helm chart
In order for the integration to work, you must configure TensorFlow Serving’s built in Prometheus metrics server.
It is required to first enable the Prometheus metrics as described in the TensorFlow Serving documentation.
Special configuration is also needed in order to enable the the Prometheus batching metrics. Batching configuration can be enabled as described in the TensorFlow Serving documentation.
Configuration snippets for Kubernetes Helm chart
The following snippets provide examples to guide you through the configuration process.
To scrape your Tensorflow Serving instances, manually modify your Kubernetes Monitoring Helm chart with these configuration snippets.
Replace any values between the angle brackets <> in the provided snippets with your desired configuration values.
Metrics snippets
alloy-metrics:
    extraConfig: |-
        discovery.kubernetes "tensorflow_metrics" {
            role = "pod"
            selectors {
                role = "pod"
                label = "<tensorflow_pod_label_name>=<tensorflow_pod_label_value>"
            }
        }

        discovery.relabel "tensorflow_metrics" {
            targets = discovery.kubernetes.tensorflow_metrics.targets
            rule {
                source_labels = ["__address__"]
                regex         = "([^:]+)(:[0-9]+)?"
                target_label  = "instance"
                replacement   = "\${1}"
            }
        }

        prometheus.scrape "tensorflow_metrics" {
            targets      = discovery.relabel.tensorflow_metrics.output
            metrics_path = "/monitoring/prometheus/metrics"
            job_name     = "integrations/tensorflow"
            forward_to   = [prometheus.remote_write.grafana_cloud_metrics.receiver]
        }
Logs snippets
podLogs:
    extraDiscoveryRules: |-
        rule {
            source_labels = ["__meta_kubernetes_namespace", "__meta_kubernetes_pod_name"]
            separator     = ":"
            regex         = "(<tensorflow_namespace>:tensorflow.*)"
            replacement   = "tensorflow"
            target_label  = "integration"
        }

        rule {
            source_labels = ["integration", "__meta_kubernetes_pod_ip"]
            separator = ":"
            regex = "tensorflow:(.*)"
            target_label = "instance"
        }

        rule {
            source_labels = ["integration", "__meta_kubernetes_pod_node_name"]
            separator = ":"
            regex = "tensorflow:(.*)"
            target_label = "__host__"
        }

        rule {
            source_labels = ["integration"]
            regex = "tensorflow"
            replacement = "integrations/tensorflow"
            target_label = "job"
        }

        rule {
            source_labels = ["integration"]
            regex = "tensorflow"
            replacement = "tensorflow"
            target_label = "name"
        }
Dashboards
The TensorFlow Serving integration installs the following dashboards in your Grafana Cloud instance to help monitor your system.
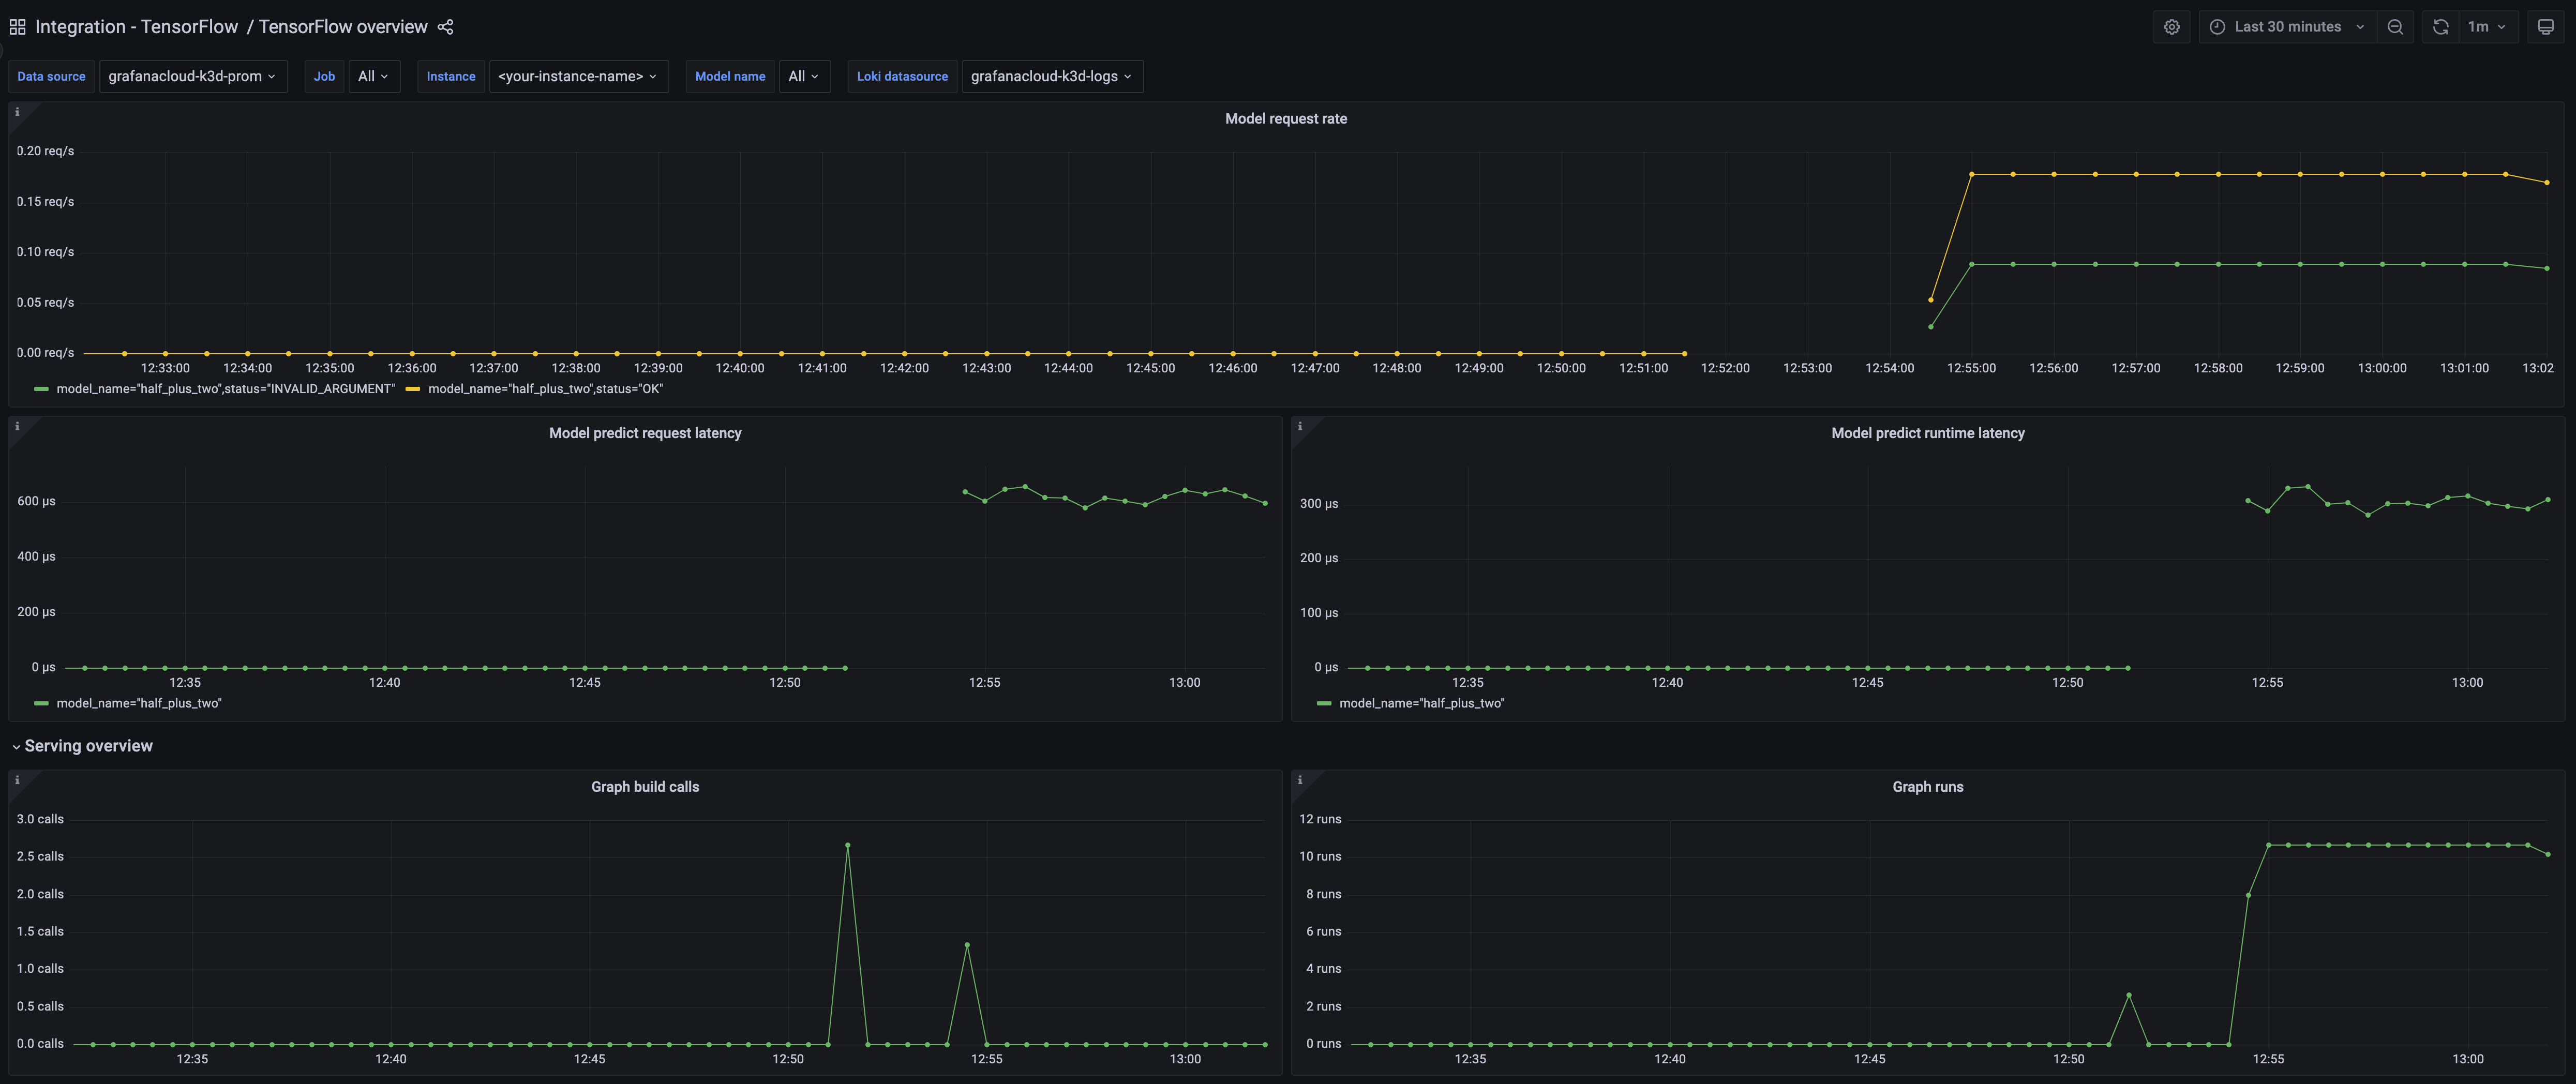
- TensorFlow Serving overview
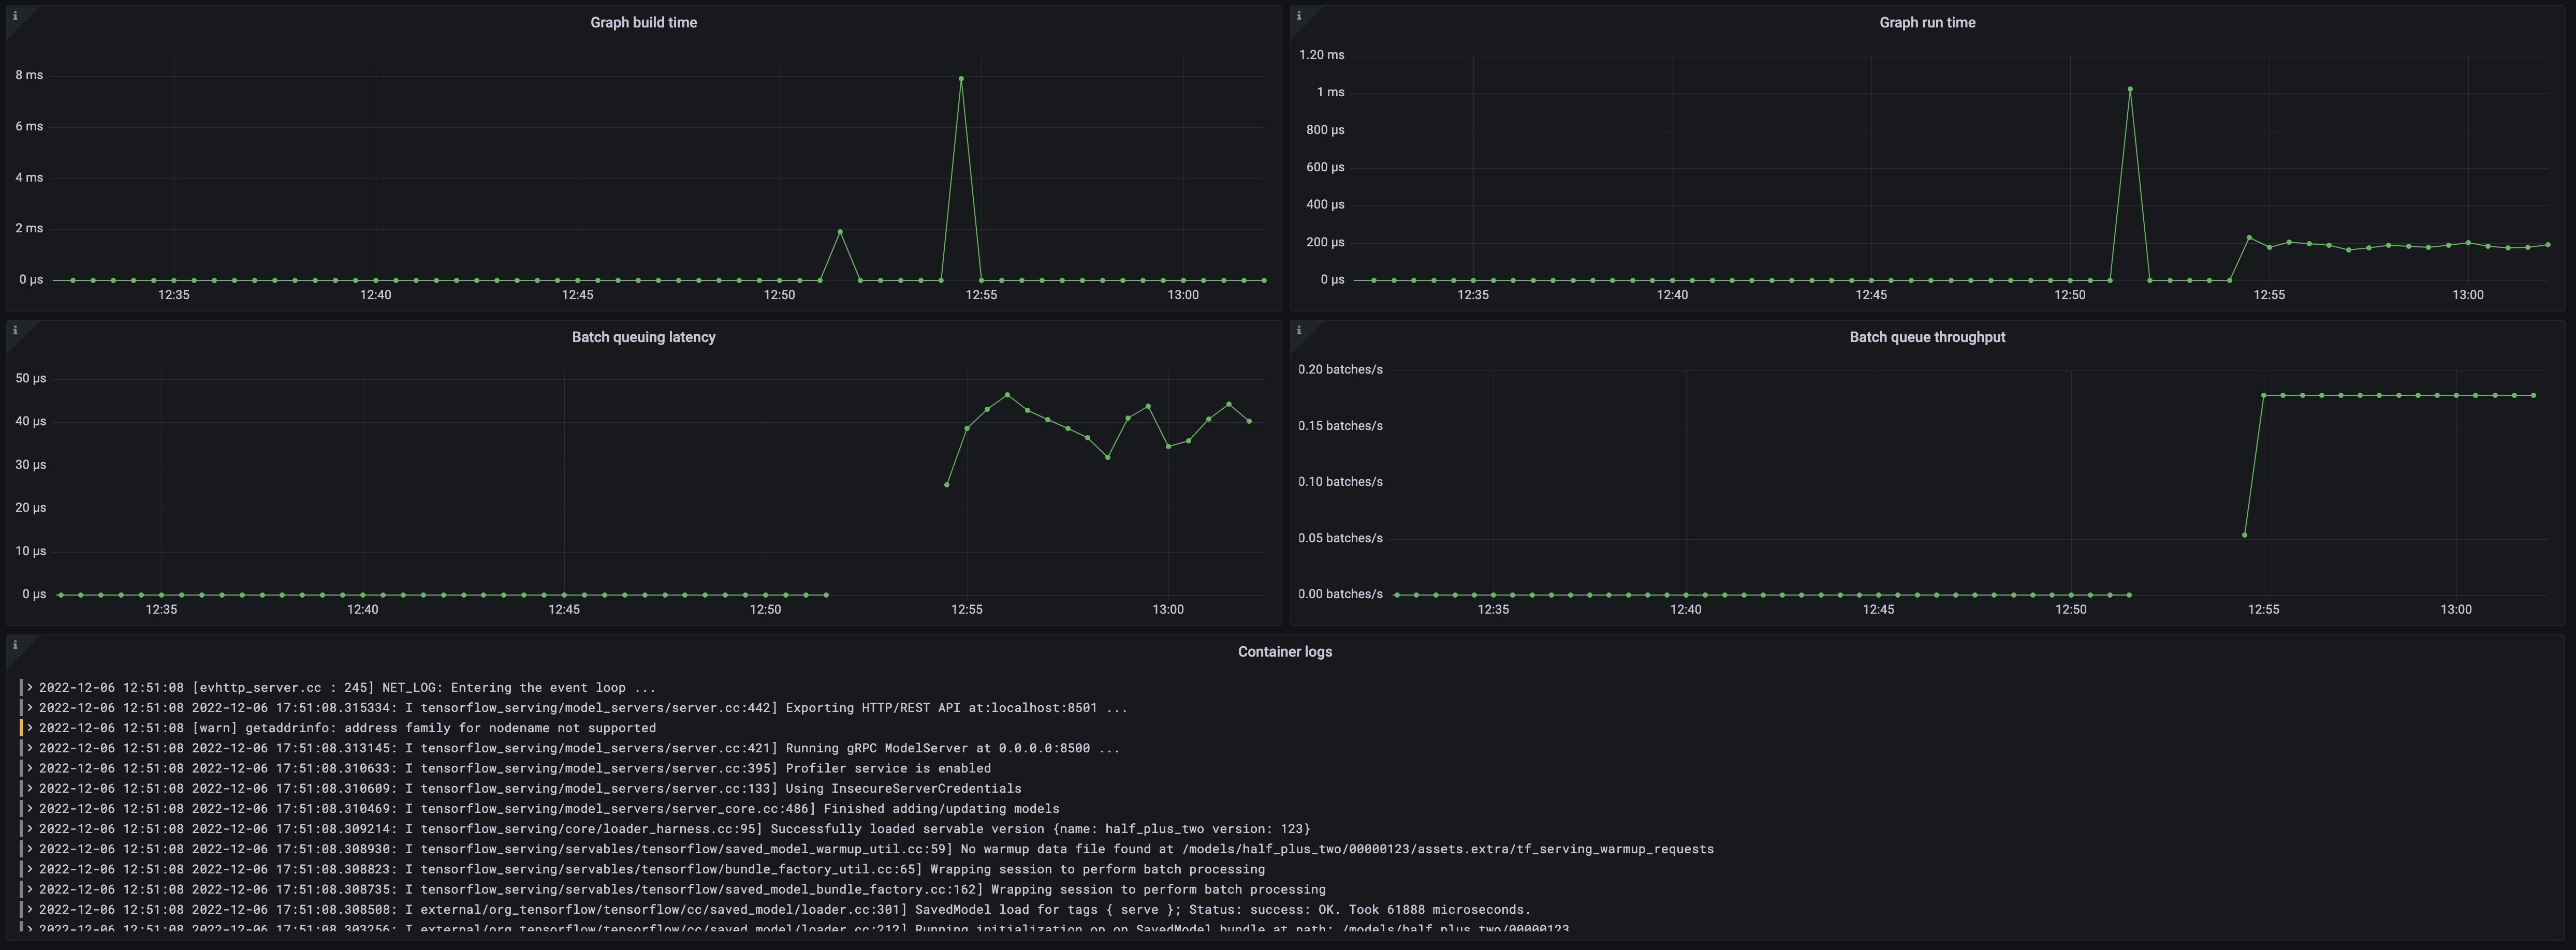
TensorFlow Serving overview dashboard 1
TensorFlow Serving overview dashboard 2
Alerts
The TensorFlow Serving integration includes the following useful alerts:
Metrics
The most important metrics provided by the TensorFlow Serving integration, which are used on the pre-built dashboard and Prometheus alerts, are as follows:
- :tensorflow:core:graph_build_calls
- :tensorflow:core:graph_build_time_usecs
- :tensorflow:core:graph_run_time_usecs
- :tensorflow:core:graph_runs
- :tensorflow:serving:batching_session:queuing_latency_count
- :tensorflow:serving:batching_session:queuing_latency_sum
- :tensorflow:serving:request_count
- :tensorflow:serving:request_latency_count
- :tensorflow:serving:request_latency_sum
- :tensorflow:serving:runtime_latency_count
- :tensorflow:serving:runtime_latency_sum
- up
Changelog
# 1.0.0 - April 2024
* Added cluster selector to dashboards for kubernetes support
* Added default cluster label to agent config
* Bump version to 1.0.0

# 0.0.4 - September 2023

* New Filter Metrics option for configuring the Grafana Agent, which saves on metrics cost by dropping any metric not used by this integration. Beware that anything custom built using metrics that are not on the snippet will stop working.
* New hostname relabel option, which applies the instance name you write on the text box to the Grafana Agent configuration snippets, making it easier and less error prone to configure this mandatory label.

# 0.0.3 - August 2023

* Add regex filter for logs datasource

# 0.0.2 - January 2023

* Updated integration name to TensorFlow Serving

# 0.0.1 - December 2022

* Initial Release
Cost
By connecting your TensorFlow Serving instance to Grafana Cloud, you might incur charges. To view information on the number of active series that your Grafana Cloud account uses for metrics included in each Cloud tier, see Active series and dpm usage and Cloud tier pricing.


