Understand your Grafana Cloud Application Observability invoice
Grafana Cloud Application Observability offers two pricing models depending on when you started using the service.
Pricing models
The following section explains the pricing models for Application Observability, so you can understand which model applies to your account.
For all new customers:
- Host hours: $0.025 per host hour (approximately $18 per host per month based on 720 hours)
- Metrics: $0.50 per 1,000 active series
- Traces: $0.50 per GB
- Logs: $0.50 per GB
- Profiles: $0.50 per GB
You pay for telemetry (metrics, traces, logs, profiles) separately from host hour usage. This model does not include telemetry credits.
For existing customers (before February 13, 2026):
- Host hours: $0.04 per host hour (approximately $29 per host per month based on 720 hours)
- Included telemetry credits: 1.5 active series and 0.02 GB of traces per host hour
Standard pricing for metrics and traces applies if you exceed included usage.
What is a host hour?
A Host is a physical or virtual operating system instance that is sending observability signals including traces and span metrics. A host is considered active if it has sent observability signals in the last 15 minutes. Billable host hours is the total number of host hours measured during the month.
By billing based on active host hours, customers are not billed for peak host usage (99th percentile), but rather the actual host hours consumed during the billing month.
Telemetry credits and overages (for existing customers before February 13, 2026)
Existing customers receive a credit of 1.5 active series and 0.02 GB of traces per host hour (approximately 1,080 active series and 14.4 GB of traces per host active for 720 hours per month). Most customers stay within this included usage. If you exceed the included amount, you pay standard rates for metrics and traces. For more details, refer to:
With Application Observability, customers can enable additional attributes for indexing, filtering, and grouping. These additional, user-configured dimensions increase metrics usage and are subject to standard pricing.
When does the host hour based pricing apply?
Host hours based pricing is only applicable for customers using the Application Observability product offering in Grafana Cloud.
For customers not using the Application Observability product offering in Grafana Cloud and instead building their own dashboards, alerts, and workflows to monitor applications, standard pricing for Grafana Cloud Metrics, Logs, Traces, Profiles, and Visualization applies and there are no charges based on host hours.
How does host hour pricing work for serverless environments?
For customers using Application Observability in serverless environments, usage is billed based on the telemetry ingested into Grafana Cloud.
Non-exhaustive list of serverless environments that are subject to telemetry-based billing:
Note: Please reach out to Grafana Support in case you rely on one of these technologies so we can validate your Grafana Environment is correctly configured. When you open the ticket use the subject “Enable Application Observability in a serverless environment”.
Usage calculations
This section describes how Grafana Cloud calculates your usage and applies charges based on your pricing model.
Pricing model for all new customers
You pay $0.025 per host hour, $0.50 per 1,000 active series (metrics), $0.50 per GB of traces, $0.50 per GB of logs, and $0.50 per GB of profiles. The new model does not include telemetry credits; you pay for all usage at the rates above.
Pricing model for existing customers (before February 13, 2026)
You pay $0.04 per host hour. Telemetry credits are included as described above. If you exceed the included credits, you pay standard rates for additional usage.
Example invoice calculation
Host hours are determined by multiplying the number of active hosts by the number of active hours per day and by the number of days per month. The examples assume 720 hours in a month.
New pricing model example
Note: Telemetry costs vary based on actual metrics, traces, logs, and profiles consumption. The estimated telemetry costs shown are examples only. Refer to Understand your Grafana Cloud Metrics invoice, Understand your Grafana Cloud Traces invoice, Understand your Grafana Cloud Logs invoice, and Understand your Grafana Cloud Profiles invoice for detailed telemetry pricing.
Pricing model example for existing customers (before February 13, 2026)
Note: This pricing includes telemetry credits (1.5 active series and 0.02 GB traces per host hour). Additional charges apply if you exceed the included telemetry.
Inquire here for volume discounts.
View a usage summary
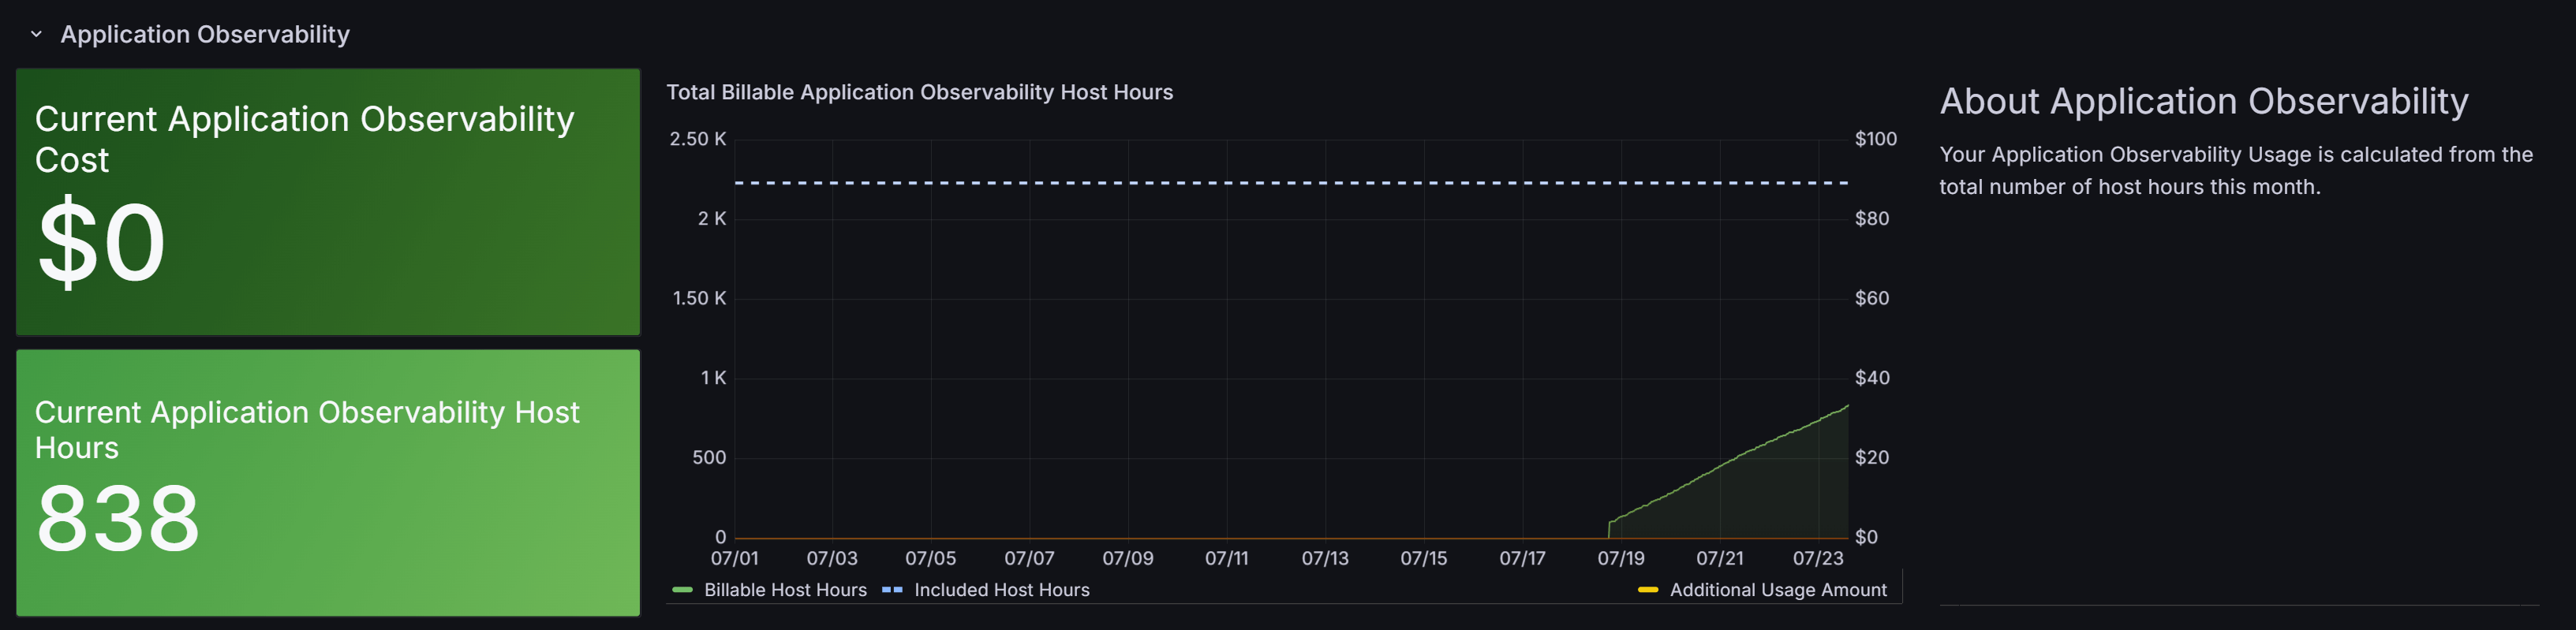
The Billing and Usage dashboard provides a usage summary for all Grafana Cloud services and billable data sources.
The Application Observability section displays information about your current Application Observability usage.
Find your invoice
You can view your invoice from your Cloud Portal.
To access your invoice:
- Sign in to Grafana Cloud.
- From the left navigation, select Billing > Invoices.
- Select an invoice to view.
The most recent invoice is listed first, and you can view and download it as a PDF or CSV file.


