Manage fair use query costs
As explained in the logs invoice topic, Grafana Cloud Logs pricing includes a fair use query policy that allows you to query up to 100x your ingested logs volume each month at no additional charge. Your query usage most likely will not exceed the fair use policy.
Billing is based on usage, and usage is determined by these primary factors:
The number of GBs ingested per month
The number of months of retention
Note
For customers exceeding the 100X fair use policy for GBs queried per month, the following billing calculations apply:
logs billable gb = max(ingested gb, queried gb / fair use query ratio)This calculation is performed on a per-stack level.
For more example billing scenarios, refer to Understand your Grafana Cloud log invoice.
Grafana Labs has analyzed customer query patterns and developed the following recommendations for how to avoid the most common causes for exceeding the fair use policy.
Recommendations
One common source of excess queries is misconfigured Grafana/Loki-managed alerting rules, for example, querying one hour of data but running that query every one minute.
For alerting rules using the Loki data source:
- Use instant queries instead of range queries for all rules. An instant query executes exactly one time and produces one data point for each series matched by your label selectors. Range queries are effectively instant queries executed multiple times. For more details, refer to the How to run faster Loki metric queries with more accurate results blog post.
- Look at the evaluation period and interval period and make their intervals match the amount of time queried. That is, a rule that runs once per minute should have a query range of
1m.
Note
We also recommend checking alert rules run by the scheduler (recorded queries).
How to view query usage
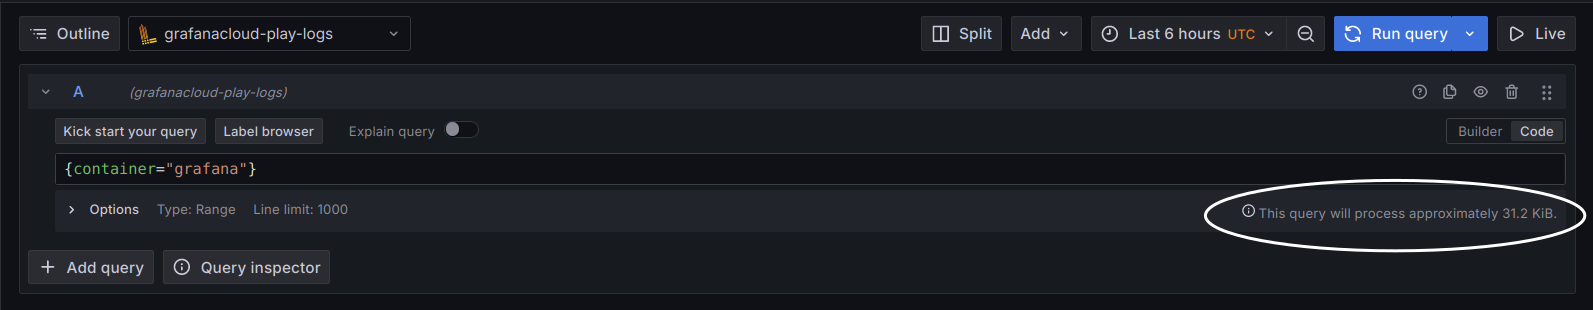
You can view query usage before you run a query. When you are writing queries in Explore, Grafana provides an estimate of how much data will be queried when you run your query.
You can use the Billing/Usage dashboard to view your current query ratio.
- From the Grafana main menu, click the Dashboard icon.
- Select the Billing/Usage dashboard.
- Scroll down to the Logs Ingestion and Query Details section.
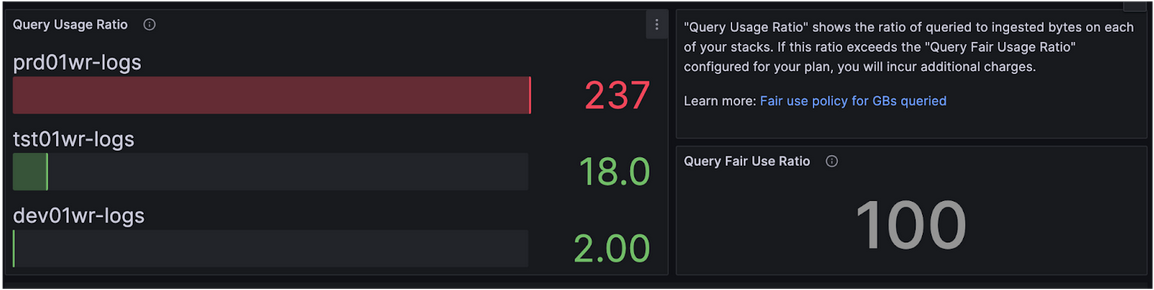
- Expand the section and scroll to the Query Usage Ratio panel.
This stack has a query usage ratio of 18.0x, which is within the fair use ratio.
Determine the source of query usage
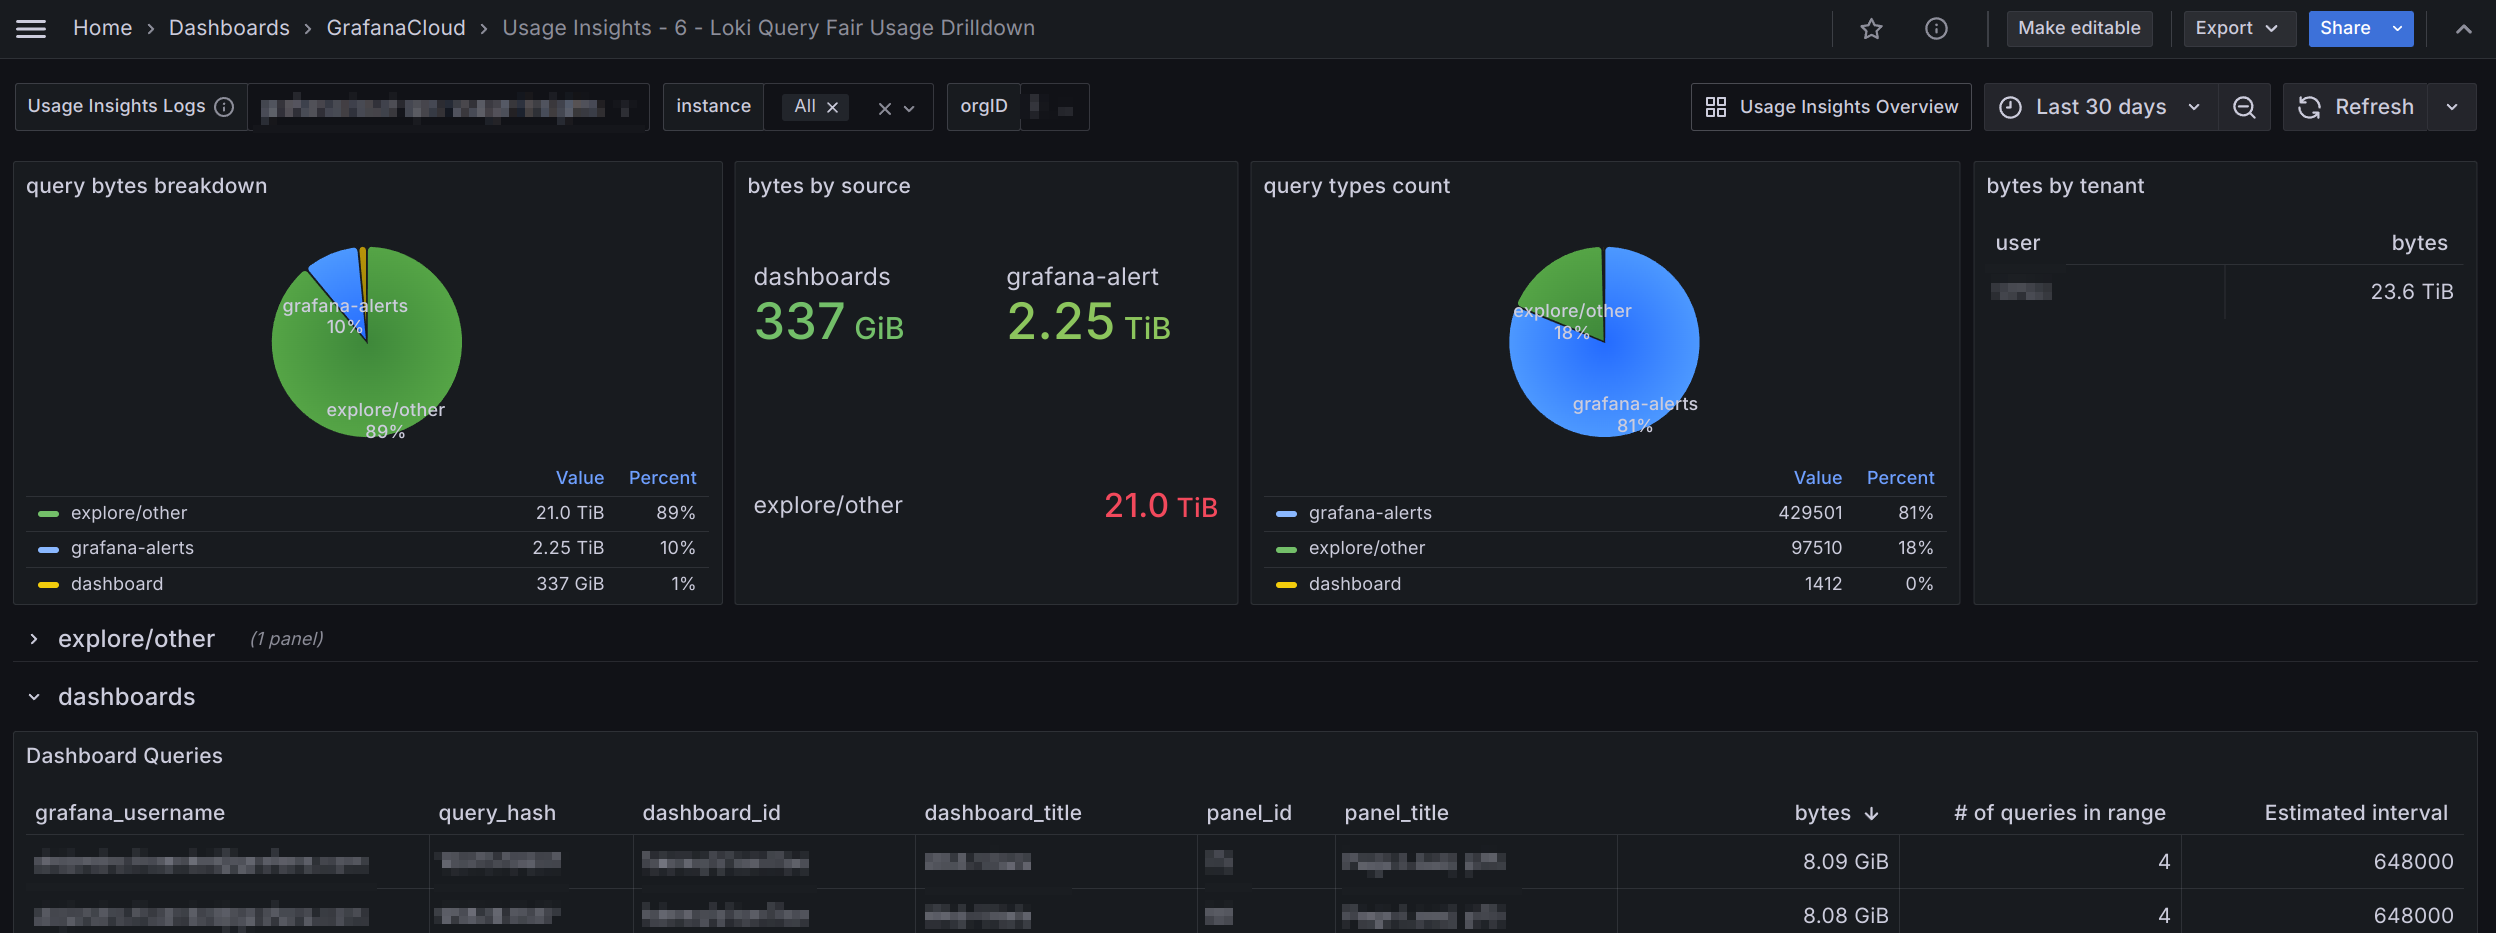
For the purposes of tracking down the source of query usage, we have built the Loki Query Fair Usage dashboard. For Grafana Cloud customers using Hosted Grafana, this dashboard is automatically provisioned on each of your Hosted Grafana instances.
The dashboard shows a breakdown of query type, dashboard, grafana-alert, and Explore/other, by query bytes and query count. For each of these types there are rows showing more detailed information on highest volume queries. It includes:
- the originating query
- the Grafana username that submitted the query (if relevant)
- rule and dashboard names
- query size in bytes
- query execution frequency
Definitions
grafana-alert refers to rules managed within Grafana under the Alerting app found at Home > Alerts & IRM > Alerting. These rules can be alerts or recording rules. These are separate from the rules you upload to Loki with
cortextoolorlokitoolusing the Grafana Cloud APIs.Explore/other refers to a subset of queries executed against Loki that come from the Explore page. It doesn’t include those coming from the Grafana Logs Drilldown app.
It also includes queries that come from a non-Grafana frontend source such as
logcli.Explore queries likely have a grafana_username populated in the dashboard, queries from other sources don’t.
Estimated interval is the estimation of how frequently the query ran over the selected time period.
It’s the number of times the query ran divided by the total time range.


