Analyze metrics usage with Grafana Explore
You can use Grafana Explore to review metrics usage and analyze your usage. This method is the manual version of using cardinality dashboards.
In addition, you can use the Adaptive Metrics cost optimization tooling to help reduce costs.
Select the data source
Begin by logging in to your Grafana Cloud organization and navigating to the Cloud Portal. From there, click Log In on your Grafana instance.
From the Grafana UI, click Explore in the left-side menu.
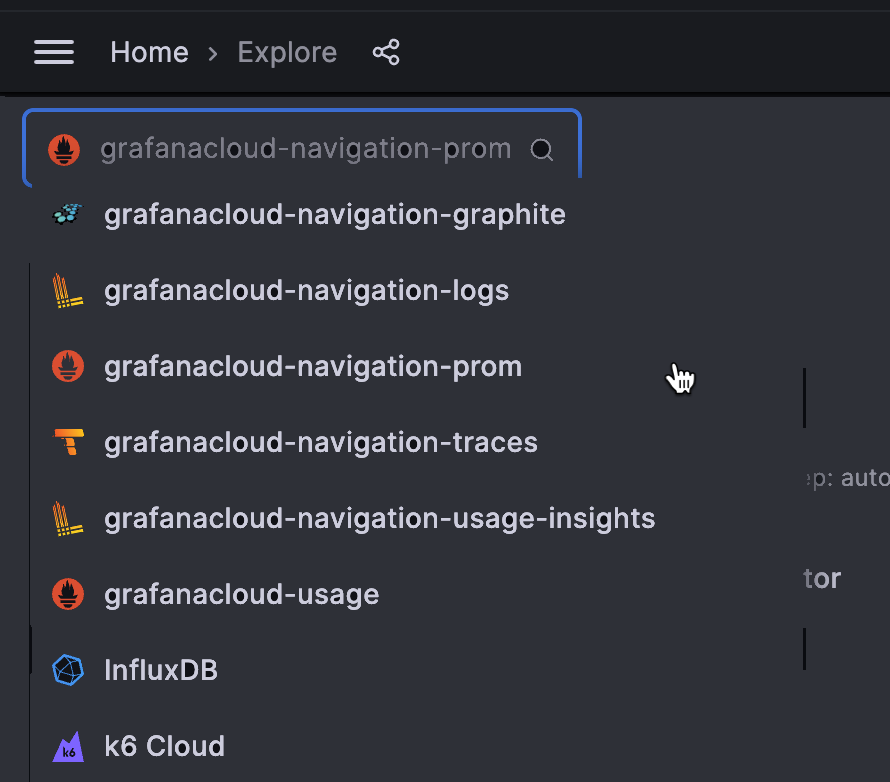
Using the data sources dropdown, select the data source corresponding to your Cloud Prometheus metrics endpoint. Its name will be grafanacloud-your_stack_name-prom:

Change the time range
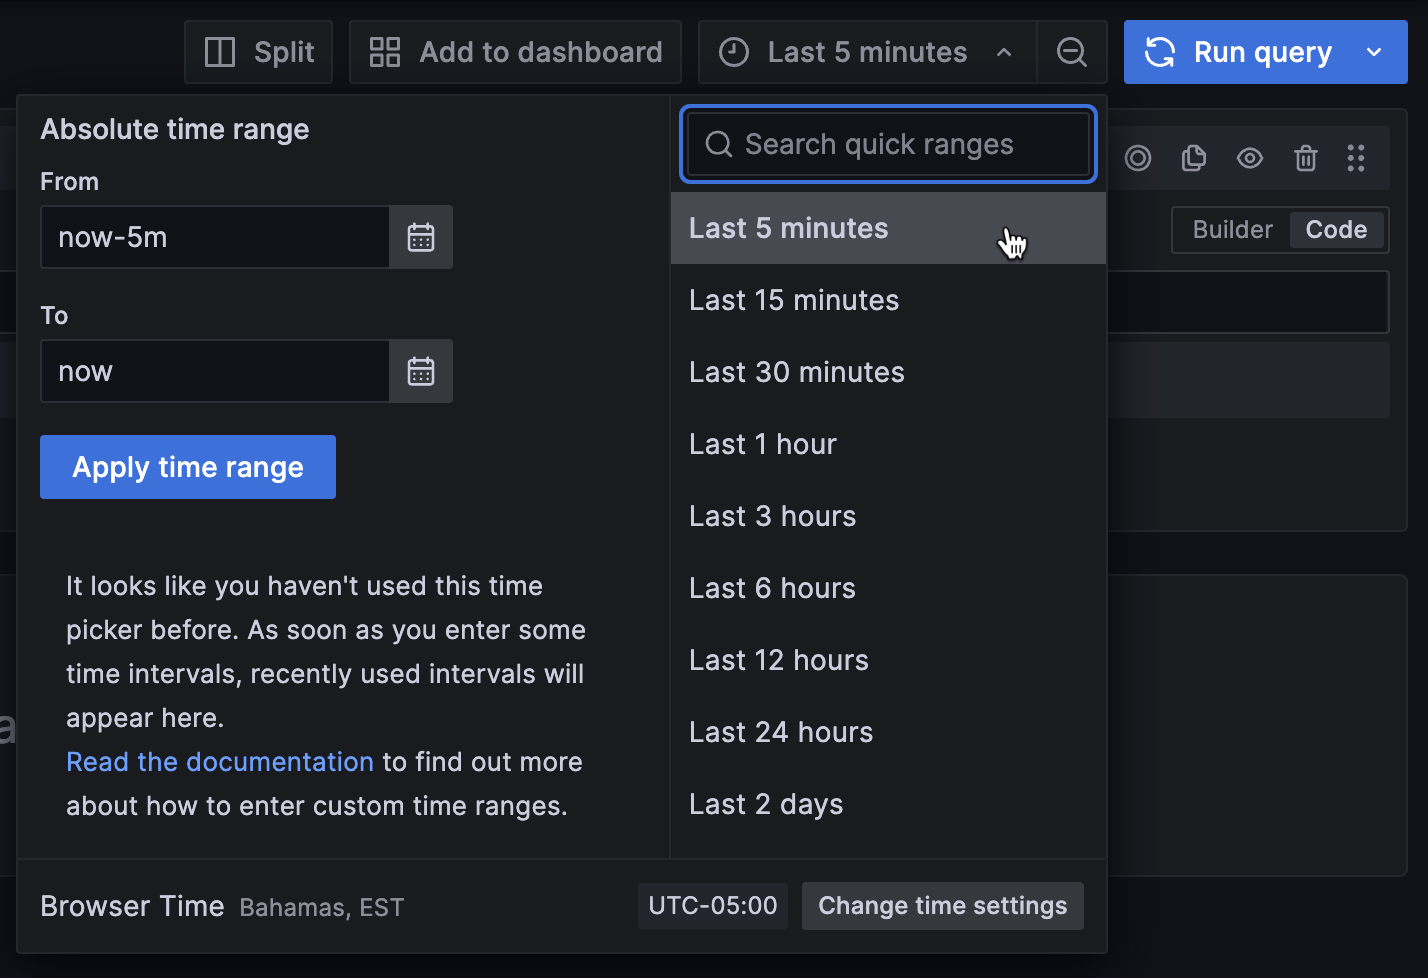
Once you’ve selected the correct data source, change the time window for the query to Last 5 minutes:

If you don’t do this, you’ll get an “expanding series: query must contain metric name” error, as Grafana Cloud limits the size of expensive queries.
Query the data source
Now that you’ve adjusted the time range for your query, enter the following PromQL query in the query toolbar:
topk(10, count by (__name__)({__name__=~".+"}))
This query finds the 10 metrics with the highest cardinality.
Next, change the query Type to Instant. Your metrics cardinalities are likely not changing over time, so we just need a snapshot of the current counts, and not a graph of metrics and their cardinalities over time.
When you’re done, hit SHIFT+ENTER or click Run query in the top right corner of your screen. You should see the a table with metrics and their corresponding cardinalities:

You can adjust the 10 parameter in the PromQL query to any number or omit the topk operator entirely:
count by (__name__)({__name__=~".+"})This will return a list of all metrics and their associated cardinalities. To learn more about these queries and PromQL, please see Querying Prometheus from the official Prometheus documentation.
From here, you can query any individual high-cardinality metric to drill down into all its different permutations. For example, the apiserver_request_duration_seconds_bucket metric above has 8294 different label combinations, so we can dig in by querying it. Ensure that query Type is still set to Instant or your query may time out:

This returns a list of series for the apiserver_request_duration_seconds_bucket metric across all label values.
Review results
To count the dimensionality of a label, or the number of unique values for a given label, run the following query:
count(count by (label_name) (metric_name))Be sure to replace label_name with the name of the label, and metric_name with the name of the metric. In the example above, this query would be:
count(count by (verb) (apiserver_request_duration_seconds_bucket))To count the number of unique values for the HTTP verb label and apiserver_request_duration_seconds_bucket metric.
By digging into label dimensionality, you can identify high-cardinality labels that you can optimize by dropping, aggregating, or using recording rules. For more information, refer to Reduce metrics costs by filtering collected and forwarded metrics.
NOTE: If you have a large number of active series or larger endpoints (100k’s of series and bigger), the analytical Prometheus queries might run longer than the Grafana Explorer is configured to wait (for results to be available). In this case, read Analyzing metrics usage with the Prometheus API


