
Introduction to Adaptive Metrics
Adaptive Metrics makes it easier for you to manage your metric volume and associated costs in Grafana Cloud.
By analyzing how your metrics are being used across dashboards, alerts, recording rules and queries, it provides recommendations for aggregating underutilized metrics into lower-cardinality versions. It then continuously reanalyzes your usage, updating its recommendations to reflect changes in your observability needs.
Apply these recommendations, or define your own rules, through a flexible system of segments tailored to your teams and infrastructure. This ensures efficient metric management, better performance, and optimized spending on your Grafana Cloud metrics.
Learn more about the fundamentals and available features that help you optimize your use of Adaptive Metrics.
How it works at a glance
The following diagram gives you an overview of Adaptive Metrics and introduces you to some of the fundamental features that are the principles of how Adaptive Metrics works.
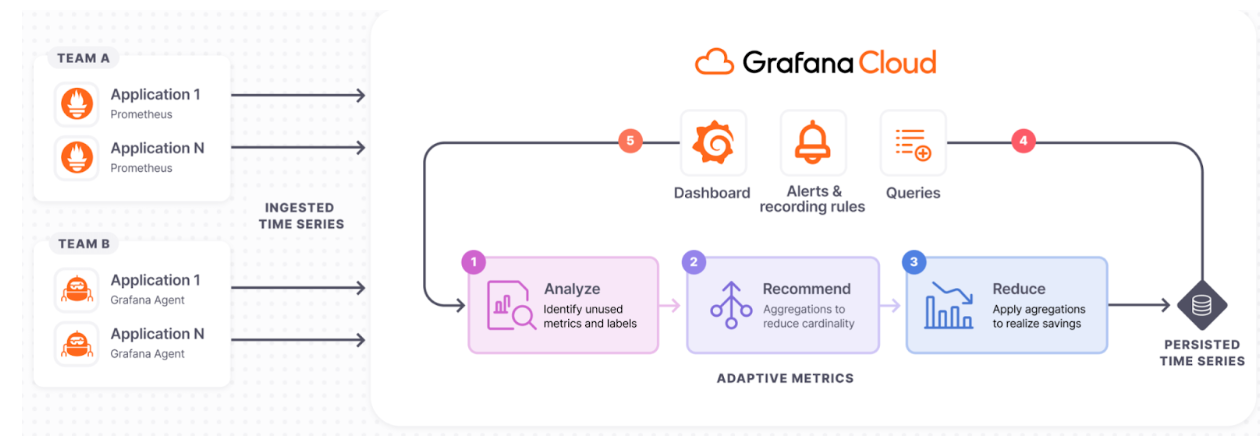
Analyze
Adaptive Metrics works by analyzing how your organization interacts with its metrics in Grafana Cloud. It determines whether a metric is unused, partially unused, or an integral part of your observability ecosystem.
It also analyzes factors such as metric type, number of label values associated, and churn, so that it can provide efficient aggregation recommendations.
Recommend
Adaptive Metrics recommends aggregations to reduce cardinality.
For unused metrics, Adaptive Metrics recommends aggregating away the ones that are driving the majority of the cardinality while preserving the others. For already aggregated metrics, if they’ve been queried recently, Adaptive Metrics may suggest removing the aggregation rules to restore full granularity.
Reduce
Based on user approval, the system applies the chosen recommendations to lower the count of persisted time series. The process is seamless, ensuring that existing dashboards, rules, and ad-hoc queries continue to work without modification.
Recommendations are applied, modified, or skipped entirely based on user input.
For a fully automated workflow, the auto-apply feature enables the system to implement new recommendations without manual intervention.
Integrate
Dashboards, alerts, and queries use persisted time series, ensuring seamless operation of existing observability artefacts.
Adapt
Analysis is continuous, so changes in dashboards, alerts, and query patterns prompt new aggregation suggestions.
Metrics usage can change over time, so Adaptive Metrics continually updates its recommendations to meet your changing needs and to reflect what is best for your current usage. It is just as easy to remove aggregations as it is to apply them. Once you tell Adaptive Metrics you want to stop aggregating a metric that’s currently being aggregated, the metric is stored in its full cardinality state going forward.
Your workflow
Adaptive Metrics integrates into your observability workflow to help you get the most value from your metrics, simplifying optimization to reduce costs and lower Mean Time to Resolution (MTTR).
Adaptive Metrics is enabled by default, continuously analyzing your metric usage in the background to find optimization opportunities.
Review and apply recommendations
When the system identifies an opportunity to reduce cardinality, a recommendation appears on the Recommendations page. Your first action is typically to review the recommendation. If you agree with it, you can apply it, knowing your existing dashboards and alerts will continue to work seamlessly.
Customize and control
When automated suggestions aren’t a perfect fit or you want to be more proactive, you can move from accepting recommendations to defining your own logic. From the Rules page, you can create custom aggregation rules for specific metrics or define Exemptions to protect critical metrics from ever being aggregated. You can manage these custom settings through the UI, or automate them as code using the API and Terraform.
Organize by team with segmentation
As your organization grows, you can use segmentation to manage Adaptive Metrics on a per-team or per-service basis. This team-centric approach allows you to tailor rules and recommendations to each team’s specific data. With segments in place, each team can filter the UI to view recommendations and manage rules that apply only to their specific metrics, empowering them to control their own metric costs and cardinality.
Enable auto-apply for a hands-off approach
Once you are comfortable with the recommendations and have protected critical metrics with exemptions, you can enable auto-apply for a fully automated workflow. From the Configuration page, you can enable auto-apply for the default segment or for specific team segments. Once enabled, the system automatically applies new optimization recommendations as they are generated, continuously fine-tuning your environment without requiring any manual review.
Supported metrics formats
Grafana Cloud accepts metrics data in a variety of formats, and Adaptive Metrics is compatible with the following subset of formats.
Before you begin
Check if you are sending metadata for your metrics by sending a request to the HTTP API metadata endpoint.
curl -u "$METRICS_INSTANCE_ID:$API_KEY" "https://<cluster>.grafana.net/prometheus/api/v1/metadata"Note
Adaptive Metrics uses Prometheus metrics metadata stored in your Grafana Hosted Metrics instance to make sure that recommendations are safe to apply mathematically.
For example, for a counter-type metric, recommendations by Adaptive Metrics make sure that counter resets are handled correctly during aggregation.
If metrics metadata is not available for a metric, and Adaptive Metrics is unable to infer a metric’s type from its name or usage patterns, a default recommendation will be produced for that metric which supports the most common aggregation functions (sum(…), count(…), avg(…), and sum(rate(…))).
If you are using a metrics format other than Prometheus or OpenTelemetry, metrics metadata is not preserved. As a result, recommendations for those metrics may store more data than strictly necessary and produce lower cost savings.
Aggregation service: requirements on sample age
The aggregation service can only aggregate raw samples that are relatively recent, it rejects samples for metrics being aggregated that arrive with too much delay.
The delay in this case is not calculated relative to wall clock time, it is the delta between the timestamp of a sample which gets ingested into an aggregated series and the timestamp of the newest sample that has already been ingested into that same aggregated series.
This means that if all samples that get ingested into a given aggregated series have a delay of 10 minutes relative to wall clock time, this is OK. However, if some have a timestamp which is equal to wall clock time and others have a delay of 10 minutes relative to wall clock time, then the delayed samples get dropped.
By default the maximum allowed delay is 90 seconds, this can be tuned in each aggregation rule via the parameter aggregation_delay as documented in Define metrics aggregation rules.
If Grafana Cloud rejects samples for this reason, you can see an increase in aggregator-sample-too-old errors on the Discarded Metrics Samples panel of your billing dashboard.
This sample age requirement only applies to samples that belong to metrics that are being aggregated by Adaptive Metrics. For more information and troubleshooting steps, refer to Troubleshoot Discarded Raw Samples. Why this happens
To compute an aggregation, you must wait for all raw samples associated with that metric to arrive. We don’t know how many samples will arrive, nor can we wait indefinitely on those samples, because the longer we wait, the longer the delay in the data being queryable and/or visible in dashboards.
If a sample arrives after our configured waiting time, it does not get taken into account during the computation of the aggregated value. Because our metrics database is immutable once the aggregation has been computed, we cannot update the aggregated value to reflect this late arriving data point.


