
Troubleshoot Private Data source Connect (PDC)
This document provides troubleshooting guidance for PDC agent issues and connectivity problems with PDC-connected data sources.
Common PDC errors
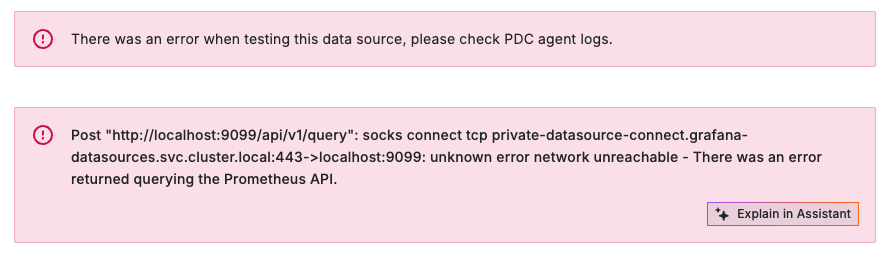
Some data source query errors have an error message containing a string like socks connect tcp private-datasource-connect.hosted-grafana.svc.cluster.local:443<ADDRESS>:<PORT>: unknown error <ERROR>. These errors can occur wherever a query is made in the UI: In the data source configuration page, in explore, or within a panel, for example. This is what the most common errors here mean:
network unreachable
The PDC system cannot find a PDC agent to send the request to. Make sure you have at least one PDC agent running and connected.
host unreachable
Most commonly, this means that a PDC agent fails to establish a TCP connection with the data source within 10 seconds. Check that the data source is reachable from where each PDC agent on a network is running.
Troubleshoot PDC agent setup
This section provides tips on common issues with the PDC agent.
Turn on PDC agent debug logging
To get more information about the PDC agent’s activity, turn on debug logging with the -log.level=debug flag. The debug logging is verbose, as they contain the openSSH logs up to debug3 level, but they provide useful information for troubleshooting.
No such file or directory
When using the PDC agent binary, if you receive the message bash: ./pdc: No such file or directory when deploying PDC agent, navigate to the directory that contains the binary files and run the command again.
No contents in compressed file
If you don’t see any files after extracting the PDC agent binary archive, you may be using an incorrect extraction command. Use tar -xvzf <filename> to properly decompress the files.
Interpret PDC agent logs
The PDC agent is a Go program that executes OpenSSH commands and captures their output. The agent logs include both OpenSSH output and internal PDC agent messages. The following are some key log entries and their meanings:
This is Grafana Private Datasource Connect!: Indicates successful connection to the PDC server. Appears each time the agent connects."ssh client exited. restarting" exitCode=<exit code>: The SSH connection terminated and the agent is reconnecting. The exit code indicates the SSH exit status. Refer to PDC agent exit codes for details.Connection to <address> port 22: Broken pipe: SSH connection to the PDC server was interrupted. Common with public internet routing and typically beyond our control. If you see this frequently, check for proxies or network infrastructure that may interfere with long-running TCP/SSH connections.Connection to private-datasource-connect-<region>.grafana.net closed by remote host.: The PDC server closed the connection from the PDC agent. This is expected during server rollouts, and the agent automatically reconnects. Running 3+ agents maintains availability during these rollouts. Contact Grafana Labs Support if this occurs frequently for extended periods (several hours or more).connect_to <address> port <port>: failed.: The PDC agent failed to establish a TCP connection to the data source. This results in ahost unreachableerror in Grafana. Verify the address is reachable from the PDC agent’s location.debug1: channel <N>: connected to <address> port <port>: Visible only with debug logging enabled. TCP connection to data source established successfully.
Interpret PDC agent metrics
The PDC agent exposes Prometheus metrics on port 8090 at /metrics by default. Refer to PDC agent metrics documentation for details.
PDC usage metrics are also available in your Grafana Cloud stack’s grafanacloud-usage data source. Refer to [Configure private data source connect (PDC)](https://grafana.com/docs/grafana-cloud/connect-externally-hosted/private-data-source-connect/configure-pdc/ for details.
PDC agent failure modes
This section covers known PDC agent failure scenarios and how to resolve them.
PDC agent intermittently fails to connect to the PDC server
In this scenario, the PDC agent intermittently connects but sometimes times out. Increasing the ConnectTimeout SSH option can resolve this issue (default is 1 second). To increase the timeout to 5 seconds, add the flag --ssh-flag='-o ConnectTimeout=5'.
PDC agent overload and unresponsiveness
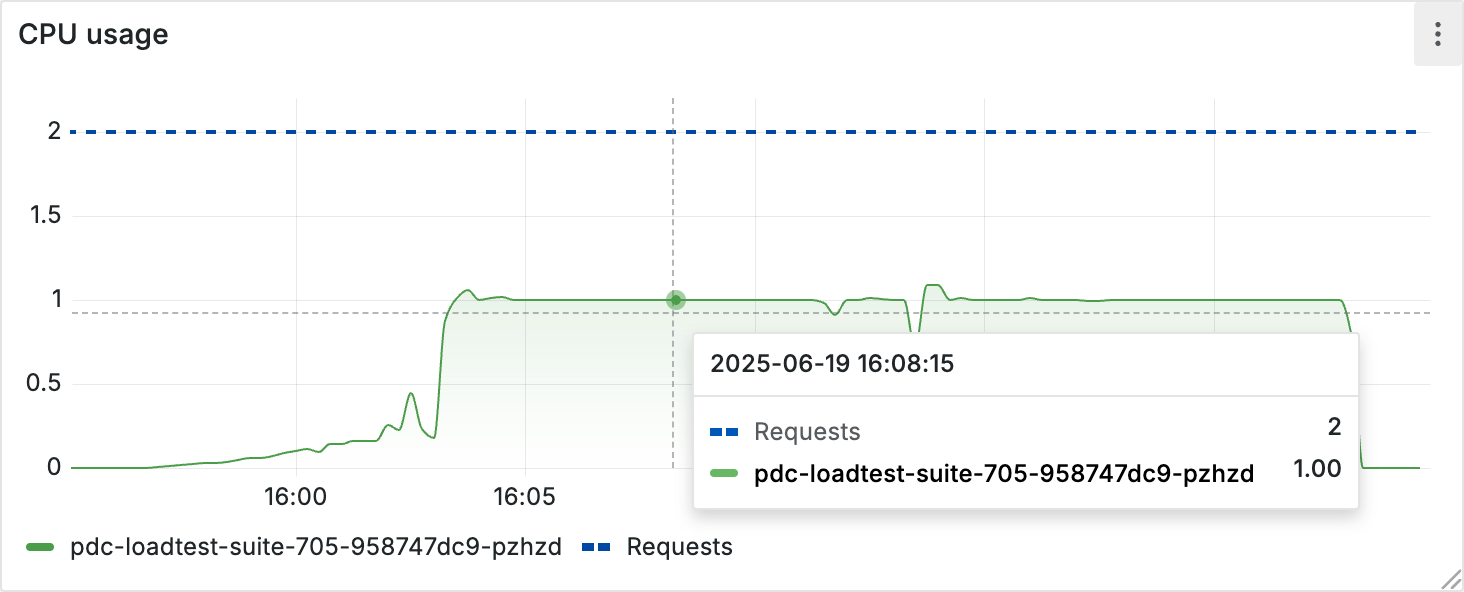
This occurs when request rates exceed the PDC agent’s capacity (typically 100-300 requests per second). In Grafana, this is usually visible as an increase in non-success replies: host unreachable, network unreachable, and general SOCKS server failure. On the PDC agent itself, the most reliable indicator is CPU usage reaching one full core.
Because OpenSSH is single-threaded, it cannot use more than one CPU core, so performance begins to degrade once this threshold is reached.
To reduce the load on an individual PDC agent, deploy additional PDC agents with the same configuration. You can use another token for the same PDC network if needed.
PDC agent exit codes
The SSH command that the PDC agent runs occasionally exits. This is normal, as long-running connections can be interrupted. Because the PDC agent’s encrypted connections to PDC servers travel over the public internet, they can be disrupted by factors such as firewall timeouts, network congestion, or hardware issues. When the SSH command exits, the PDC agent logs show the corresponding exit code, which matches the documented SSH exit statuses. The PDC agent uses OpenSSH Remote Port Forwarding, which always exits with code 255 when the connection closes. During connection attempts, the PDC server may also return additional exit codes to the PDC agent:
Exit code 253: This code indicates that the PDC server already has an active SSH connection from another PDC agent in the same PDC network. When this happens, the PDC agent immediately tries to reconnect, and the request is load-balanced, likely to a different PDC server. This mechanism ensures that PDC agent connections for a network are evenly distributed across all available PDC servers in the region. Even if there are more PDC agents than servers, each agent eventually settles on a server.
Exit code 254: This code indicates that the maximum number of PDC agents for a single PDC network has been reached. The current limit is 50 agents. When this occurs, the agent logs a message such as
limit of connections for stack and network reachedand the agent exits. If you need to connect more than 50 agents, contact Grafana Support to request an increase.


