Private data source connect (PDC)
Private data source connect, or PDC, is a way for you to establish a private, secured connection between a Grafana Cloud instance, or stack, and data sources secured within a private network.
Observability data is often located within private networks such as on-premise networks and Virtual Private Clouds (VPCs) hosted by AWS, Azure, Google Cloud Platform, or other public cloud providers. For example, you might host your Splunk or Elasticsearch service on your private network, or you might want to visualize data from Amazon RDS hosted in a VPC. PDC also allows you to connect to any network-secured data source regardless of what cloud provider you use, or if you host your own data in an on-premises network.
The following resources will help you get started working with PDC:
Understand and set up PDC:
- PDC key concepts and features
- Scalability and security
- Configure PDC
- Best practices for data source configuration
Connect the PDC agent through a cloud provider private network:
Reference and troubleshooting:
Did you know?
We have partnered with Tailscale to provide a new way to query data sources on your Tailscale network directly from your Grafana Cloud stack.
Learn more about PDC over Tailscale and sign up for access to the private preview.
Private data source connect (PDC) concepts
Unlike a VPN, PDC lets you route queries to many isolated networks without having to worry about overlapping subnets. Queries and data are routed and encrypted from your Grafana Cloud instance through the PDC agent deployed within your network. You deploy and manage the agent, so PDC is entirely within your control.
The PDC agent runs a SOCKS5 SSH tunnel from your network to a Grafana Cloud managed reverse proxy. Traffic between Grafana Cloud and the agent is encrypted using an SSH key pair that the agent generates automatically at startup. You can also provide your own key pair using the -ssh-key-file flag.
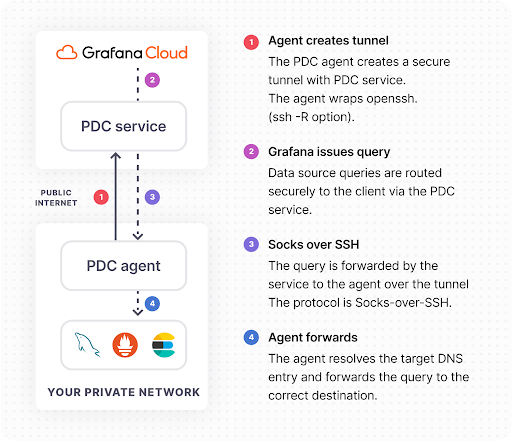
PDC operates at a high level in the following manner:
The PDC agent initiates an SSH connection with the Grafana data source connect service. The SSH client running in your network is configured with reverse dynamic forwarding using the -R <port> option. In this mode, SSH acts as a SOCKS proxy and forwards connections to destinations requested by Grafana.
Whenever your Grafana instance needs to query your private data source, the TCP connection is wrapped in a secure SOCKS connection and then routed to the Grafana PDC service.
SOCKS packets are forwarded to the PDC agent through the SSH connection.
The PDC agent resolves the DNS of the data source endpoint and establishes a secure connection to the data source.
PDC advantages
The Grafana Labs PDC solution offers several advantages:
The monitoring and supervision of the SSH tunnel are delegated to an agent running inside your private network. At any time, you can shut off the agent, which terminates the connection. PDC is entirely within your control, since you deploy and manage the agent.
The agent running inside your private network is a horizontally scalable component to ensure fault-tolerance. This means you can deploy multiple agents within the same network, and Grafana Cloud load balances across them automatically.
Traffic is encrypted all the way from your Grafana Cloud stack to the SSH client running in your private network. If the private data source supports encryption (for example, HTTPS), traffic will be encrypted end-to-end.
In your Grafana Cloud instance, you can configure compatible data sources to route requests through the SSH tunnel. Each data source is configured using the internal DNS name (for example, mysql.your.domain:3306), as if Grafana were running directly inside the private network.
You can restrict the destinations reachable by Grafana Cloud over this tunnel using the PermitRemoteOpen SSH option. For example, you can restrict the agent to permit access to only certain hostnames, ports or IP addresses.
You can route each session transparently and securely to the correct connection without having to deal with CIDR ranges.
Routing requests through PDC has a negligible effect on query time. PDC only increases request time by tens of milliseconds on average.
PDC known limitations
PDC has the following known limitations:
- PDC only supports backend data source plugins. Frontend data sources cannot use PDC because the proxy connection is established from the backend.
- Each PDC agent uses a single-threaded OpenSSH process, so it can only use one CPU core. Performance begins to degrade beyond approximately 100-300 requests per second per agent. To increase throughput, use the
-connectionsflag to open multiple parallel SSH connections, or deploy additional agents. - A single PDC network supports a maximum of 50 connected agents. Contact Grafana Support to request an increase.
- The SOCKS5 protocol can add minor latency to queries, typically tens of milliseconds, which should not be readily noticeable.
Supported data sources
The following data sources support PDC:


