Azure Monitor query editor
Grafana provides a query editor for the Azure Monitor data source, which is located on the Explore page. You can also access the Azure Monitor query editor from a dashboard panel. Click the menu in the upper right of the panel and select Edit.
This document explains querying specific to the Azure Monitor data source. For general documentation on querying data sources in Grafana, refer to Query and transform data.
The Azure Monitor data source can query data from Azure Monitor Metrics and Logs, the Azure Resource Graph, and Application Insights Traces. Each source has its own specialized query editor.
Before you begin
- Ensure you have configured the Azure Monitor data source.
- Verify your credentials have appropriate permissions for the resources you want to query.
Key concepts
If you’re new to Azure Monitor, here are some key terms used throughout this documentation:
Choose a query editor mode
The Azure Monitor data source’s query editor has four modes depending on which Azure service you want to query:
- Metrics for Azure Monitor Metrics
- Logs for Azure Monitor Logs
- Traces for Application Insights Traces
- Azure Resource Graph for Azure Resource Graph
Query Azure Monitor Metrics
Azure Monitor Metrics collects numeric data from supported resources, and you can query them to investigate your resources’ health and usage and maximize availability and performance.
Monitor Metrics use a lightweight format that stores only numeric data in a specific structure and supports near real-time scenarios, making it useful for fast detection of issues. In contrast, Azure Monitor Logs can store a variety of data types, each with their own structure.

Create a Metrics query
To create a Metrics query:
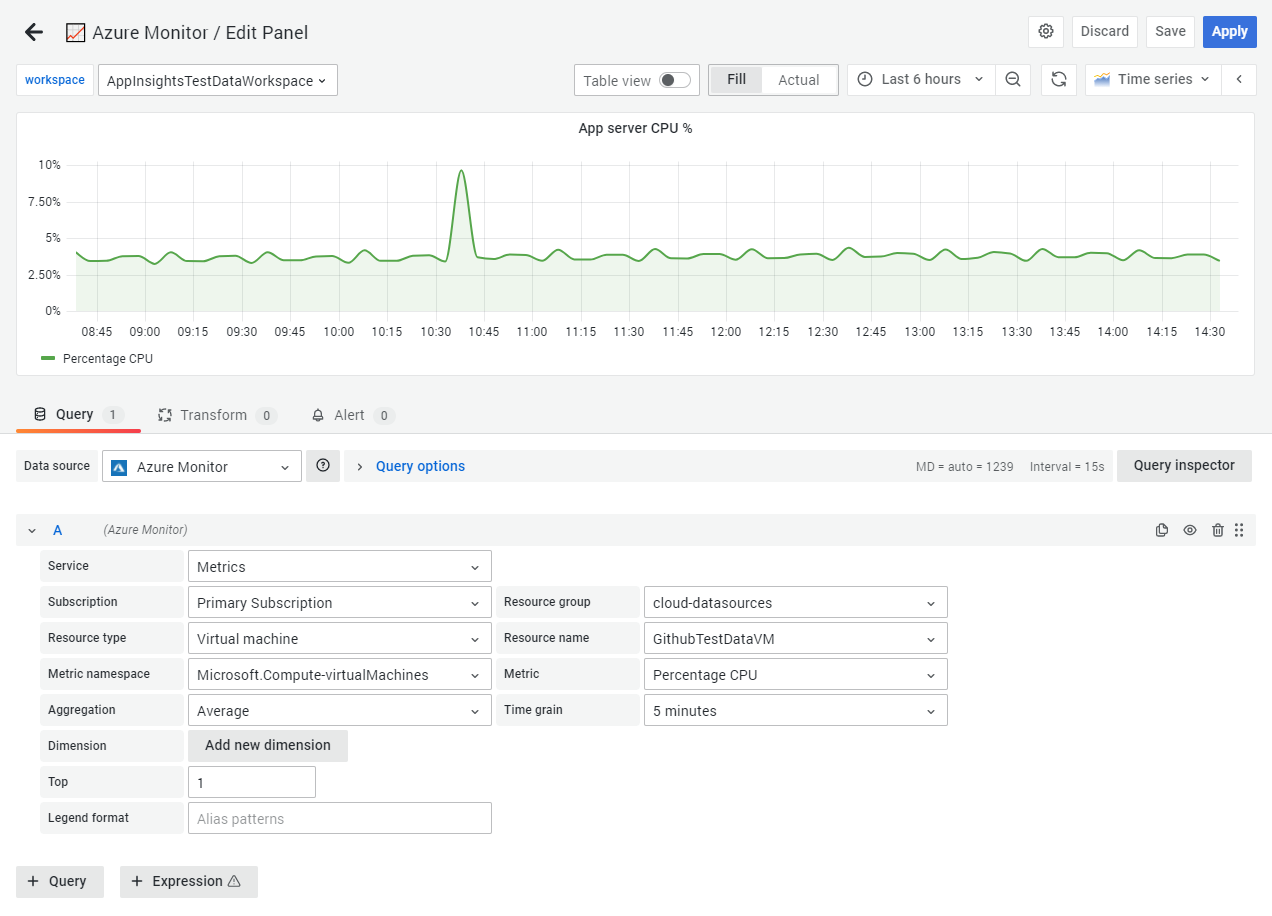
In a Grafana panel, select the Azure Monitor data source.
Select the Metrics service.
Select a resource from which to query metrics by using the subscription, resource group, resource type, and resource fields. Multiple resources can also be selected as long as they belong to the same subscription, region and resource type. Note that only a limited amount of resource types support this feature.
To select a different namespace than the default—for instance, to select resources like storage accounts that are organized under multiple namespaces—use the Namespace option.
Note
Not all metrics returned by the Azure Monitor Metrics API have values.
The data source retrieves lists of supported metrics for each subscription and ignores metrics that never have values.
Select a metric from the Metric field.
Optionally, you can apply further aggregations or filter by dimensions.
- Change the aggregation from the default average to show minimum, maximum, or total values.
- Specify a custom time grain. By default, Grafana selects a time grain interval for you based on your selected time range.
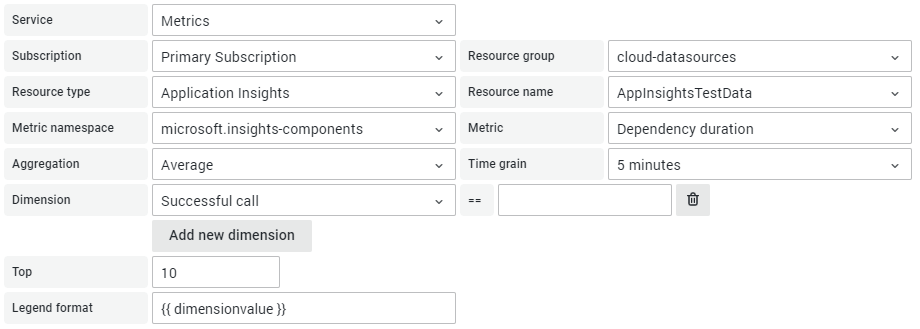
- For metrics with multiple dimensions, you can split and filter the returned metrics. For example, the Application Insights dependency calls metric supports returning multiple time series for successful and unsuccessful calls.

The available options change depending on what is relevant to the selected metric.
You can also augment queries by using template variables.
Format legend aliases
You can change the legend label for Metrics by using aliases. In the Legend Format field, you can combine aliases defined below any way you want.
For example:
Blob Type: {{ blobtype }}becomesBlob Type: PageBlob,Blob Type: BlockBlob{{ resourcegroup }} - {{ resourcename }}becomesproduction - web_server
Filter with dimensions
Some metrics also have dimensions, which associate additional metadata. Dimensions are represented as key-value pairs assigned to each value of a metric. Grafana can display and filter metrics based on dimension values.
The data source supports the equals, not equals, and starts with operators as detailed in the Monitor Metrics API documentation.
For more information on multi-dimensional metrics, refer to the Azure Monitor data platform metrics documentation and Azure Monitor filtering documentation.
Query Azure Monitor Logs
Azure Monitor Logs collects and organizes log and performance data from supported resources, and makes many sources of data available to query together with the Kusto Query Language (KQL).
While Azure Monitor Metrics stores only simplified numerical data, Logs can store different data types, each with their own structure. You can also perform complex analysis of Logs data by using KQL.
The Azure Monitor data source also supports querying of Basic Logs tables (if they exist in your Log Analytics workspace). This feature must be enabled in the data source configuration.

Logs query builder (public preview)
Note
The Logs query builder is a public preview feature. It may not be enabled in all Grafana environments.
The Logs query builder provides a visual interface for building Azure Monitor Logs queries without writing KQL. This is helpful if you’re new to KQL or want to quickly build simple queries.
To enable the Logs query builder:
- Enable the
azureMonitorLogsBuilderEditorfeature toggle in your Grafana configuration. - Restart Grafana for the change to take effect.
To switch between Builder and Code modes:
When the feature is enabled, a Builder / Code toggle appears in the Logs query editor:
- Builder: Use the visual interface to select tables, columns, filters, and aggregations. The builder generates the KQL query for you.
- Code: Write KQL queries directly. Use this mode for complex queries that require full KQL capabilities.
New queries default to Builder mode. Existing queries that were created with raw KQL remain in Code mode.
Note
You can switch from Builder to Code mode at any time to view or edit the generated KQL. However, switching from Code to Builder mode may not preserve complex queries that can’t be represented in the builder interface.
Create a Logs query
To create a Logs query:
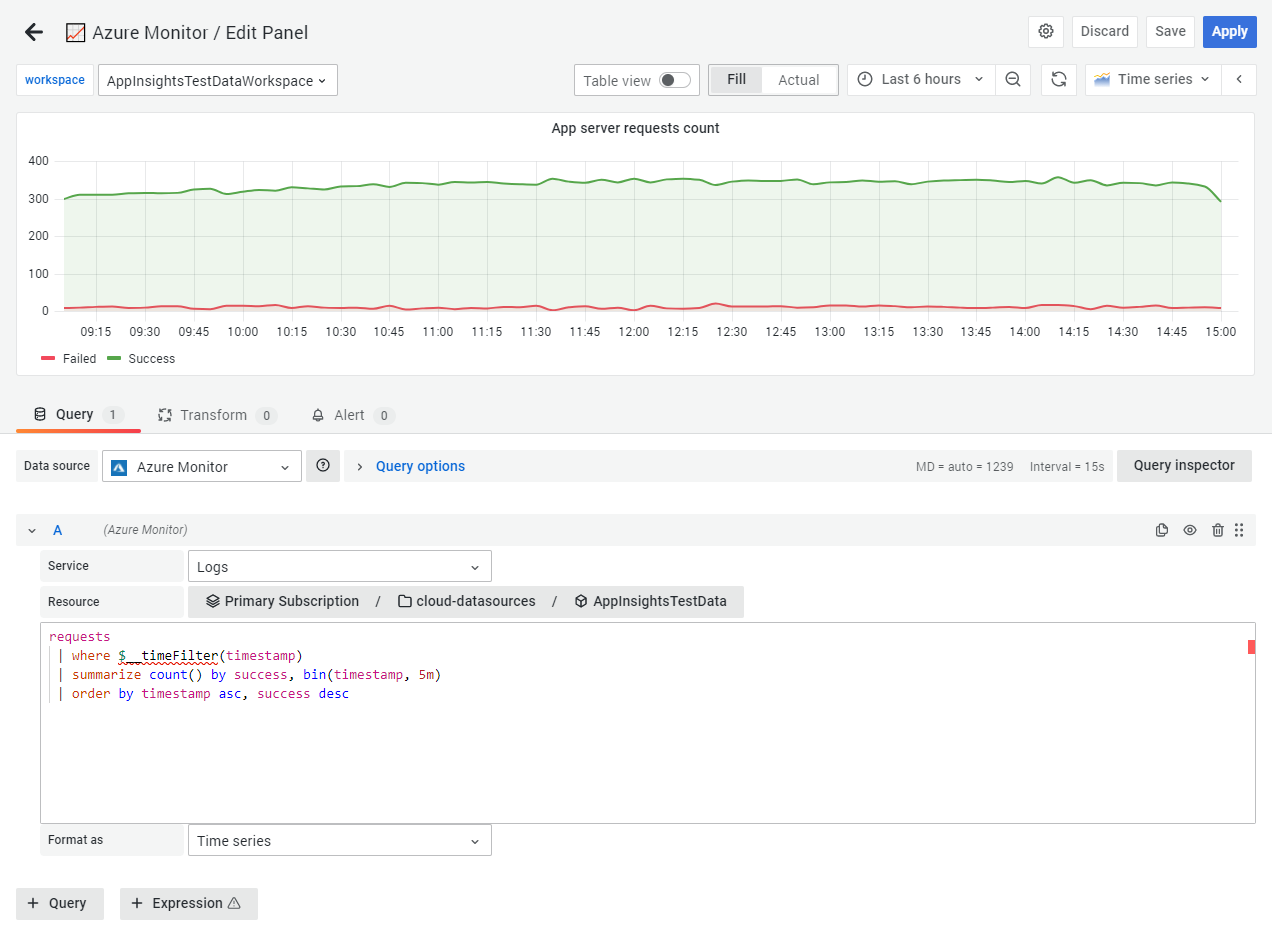
In a Grafana panel, select the Azure Monitor data source.
Select the Logs service.
Select a resource to query. Multiple resources can be selected as long as they are of the same type.
Alternatively, you can dynamically query all resources under a single resource group or subscription.
Note
If a time span is specified in the query, the overlap between the query time span and the dashboard time range will be used. See the API documentation for details.
Enter your KQL query.
You can also augment queries by using template variables.
To create a Basic Logs query:
- Ensure that the data source has the
Enable Basic Logstoggle enabled. - In a Grafana panel, select the Azure Monitor data source.
- Select the Logs service.
- Select a resource to query. Multiple resources can be selected as long as they are of the same type.
- Switch the
Logstoggle fromAnalyticstoBasic. A modal will display to notify users of potential additional costs.Note
Basic Logs queries do not support time-ranges specified in the query. The time-range will be hardcoded to the dashboard time-range. There are also other query limitations. See the documentation for details.
- Enter your KQL query.
You can also augment queries by using template variables.
Logs query examples
Azure Monitor Logs queries are written using the Kusto Query Language (KQL), a rich language similar to SQL.
The Azure documentation includes resources to help you learn KQL:
- Log queries in Azure Monitor
- Getting started with Kusto
- Tutorial: Use Kusto queries in Azure Monitor
- SQL to Kusto cheat sheet
Note
Time-range: The time-range used for the query can be modified via the time-range switch:
- Selecting Query uses only time-ranges specified within the query.
- Selecting Dashboard uses only the Grafana dashboard time-range.
- If no time-range is specified in the query, the default Log Analytics time-range applies.
For more details, refer to the Azure Monitor Logs API documentation. If you previously used the
Intersectionoption, it has been migrated toDashboard.
This example query returns a virtual machine’s CPU performance, averaged over 5-minute time grains:
Perf
// $__timeFilter is a special Grafana macro that filters the results to the time span of the dashboard
| where $__timeFilter(TimeGenerated)
| where CounterName == "% Processor Time"
| summarize avg(CounterValue) by bin(TimeGenerated, 5m), Computer
| order by TimeGenerated asc
Use time series queries for values that change over time, usually for graph visualizations such as the Time series panel. Each query should return at least a datetime column and numeric value column. The result must also be sorted in ascending order by the datetime column.
You can also create a query with at least one non-numeric, non-datetime column. Azure Monitor considers those columns to be dimensions, and they become labels in the response.
For example, this query returns the aggregated count grouped by hour, Computer, and the CounterName:
Perf
| where $__timeFilter(TimeGenerated)
| summarize count() by bin(TimeGenerated, 1h), Computer, CounterName
| order by TimeGenerated asc
You can also select additional number value columns, with or without multiple dimensions. For example, this query returns a count and average value by hour, Computer, CounterName, and InstanceName:
Perf
| where $__timeFilter(TimeGenerated)
| summarize Samples=count(), ["Avg Value"]=avg(CounterValue)
    by bin(TimeGenerated, $__interval), Computer, CounterName, InstanceName
| order by TimeGenerated asc
Use table queries with the Table panel to produce a list of columns and rows. This query returns rows with the six specified columns:
AzureActivity
| where $__timeFilter()
| project TimeGenerated, ResourceGroup, Category, OperationName, ActivityStatus, Caller
| order by TimeGenerated desc
Use macros in Logs queries
To help you write queries, you can use several Grafana macros in the where clause:
Additionally, Grafana has the built-in
$__interval macro, which calculates an interval in seconds.
Query Azure Resource Graph
Azure Resource Graph (ARG) is an Azure service designed to extend Azure Resource Management with efficient resource exploration and the ability to query at scale across a set of subscriptions, so that you can more effectively govern an environment. By querying ARG, you can query resources with complex filtering, iteratively explore resources based on governance requirements, and assess the impact of applying policies in a vast cloud environment.

Create a Resource Graph query
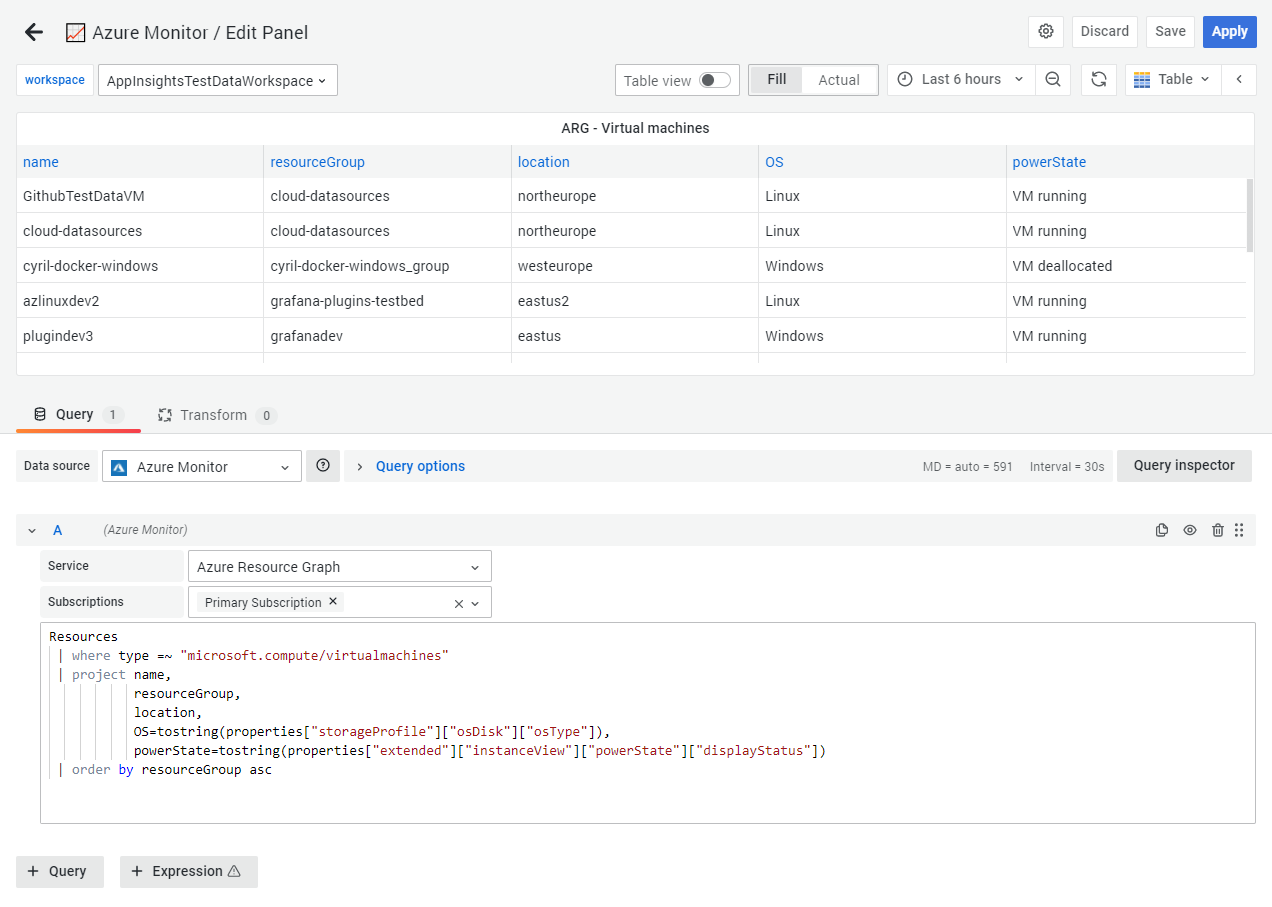
ARG queries are written in a variant of the Kusto Query Language (KQL), but not all Kusto language features are available in ARG.
An Azure Resource Graph query is formatted as table data.
If your Azure credentials grant you access to multiple subscriptions, you can choose multiple subscriptions before entering queries. It is also possible to run queries against the directory by changing the scope of the query.
Note
Some queries that function at a directory level may not work at a subscription level and vice-versa.
Resource Graph query examples
The Azure documentation also includes sample queries to help you get started.
Sort results by resource properties:
This query returns all resources in the selected subscriptions, but only the name, type, and location properties:
Resources
| project name, type, location
| order by name asc
This query uses order by to sort the properties by the name property in ascending (asc) order.
You can change which property to sort by and the order (asc or desc).
This query uses project to show only the listed properties in the results.
You can use this to add or remove properties in your queries.
Query resources with complex filtering:
You can filter for Azure resources with a tag name and value.
For example, this query returns a list of resources with an environment tag value of Internal:
Resources
| where tags.environment=~'internal'
| project name
This query uses =~ in the type match to make the query case-insensitive.
You can also use project with other properties, or add or remove more.
Group and aggregate the values by property:
You can use summarize and count to define how to group and aggregate values by property.
For example, this query returns counts of healthy, unhealthy, and not applicable resources per recommendation:
securityresources
| where type == 'microsoft.security/assessments'
| extend resourceId=id,
    recommendationId=name,
    resourceType=type,
    recommendationName=properties.displayName,
    source=properties.resourceDetails.Source,
    recommendationState=properties.status.code,
    description=properties.metadata.description,
    assessmentType=properties.metadata.assessmentType,
    remediationDescription=properties.metadata.remediationDescription,
    policyDefinitionId=properties.metadata.policyDefinitionId,
    implementationEffort=properties.metadata.implementationEffort,
    recommendationSeverity=properties.metadata.severity,
    category=properties.metadata.categories,
    userImpact=properties.metadata.userImpact,
    threats=properties.metadata.threats,
    portalLink=properties.links.azurePortal
| summarize numberOfResources=count(resourceId) by tostring(recommendationName), tostring(recommendationState)
In ARG, many nested properties (properties.displayName) are of a dynamic type and should be cast to a string with tostring() in order to operate on them.
Use macros in Resource Graph queries
To help you write queries, you can use several Grafana macros in the where clause:
Query Application Insights Traces
Azure Application Insights is a service that provides application performance monitoring (APM) features. Application insights can be used to collect metrics, telemetry, and trace logging data.
Application Insights stores trace data in an underlying Log Analytics workspace and traces can be extended to provide additional supporting information as required by the application developer.
Create a Traces query
To create a Traces query:
In a Grafana panel, select the Azure Monitor data source.
Select the Traces service.
Select a resource to query. Multiple resources can be selected as long as they are of the same type.
Note
This query type only supports Application Insights resources.
(Optional) Specify an Operation ID value to filter traces.
(Optional) Specify event types to filter by.
(Optional) Specify event properties to filter by.
(Optional) Change the Result format to switch between tabular format and trace format.
Note
Selecting the trace format filters events to only the
tracetype. Use this format with the Trace visualization.
Running a query returns all trace data within the time span specified by the panel or dashboard time range.
You can also augment queries by using template variables.
Use queries for alerting and recording rules
All Azure Monitor query types (Metrics, Logs, Azure Resource Graph, and Traces) can be used with Grafana Alerting and recording rules.
For detailed information about creating alert rules, supported query types, authentication requirements, and examples, refer to Azure Monitor alerting.
Work with large Azure resource datasets
If a request exceeds the maximum allowed value of records, the result is paginated and only the first page of results are returned. You can use filters to reduce the amount of records returned under that value.
Next steps
- Use template variables to create dynamic, reusable dashboards
- Add annotations to overlay events on your graphs
- Set up alerting to create alert rules based on Azure Monitor data
- Troubleshoot common query and configuration issues


