
Reduce metrics costs by adjusting your data points per minute (DPM)
Grafana Cloud calculates metrics using data points per minute (DPM) as described in Active series and DPM for billing calculations. You can optimize your scrape interval (how frequently targets are scraped from a job) to improve your DPM and thus better control your usage.
To manage costs, you can take steps to reduce the data points per minutes (DPM) of your active series. All customers have an included DPM per series that depends on their account. Although some customers choose to ship data points to Grafana Cloud more frequently than their included DPM per series, for many customers, shipping data points at this higher frequency (and cost) is not desired, and is instead the result of a misconfiguration.
This guide shows how to identify excess usage caused by small scrape intervals. You’ll also learn how to reduce your DPM by changing your scrape interval.
To understand metrics and time-series, you can read a detailed explanation of the Prometheus data model in the Prometheus documentation. For more information on scrape intervals, see the Prometheus scrape configuration documentation.
Before you begin
To complete the steps in this guide, you’ll need the following:
- A Grafana Cloud account
- Metrics data in your Grafana Cloud account
Identify high DPM per series
To identify if your DPM per series is higher than that included in your plan:
Log in to your GrafanaCloud instance.
Load up the Billing/Usage dashboard in the GrafanaCloud folder.
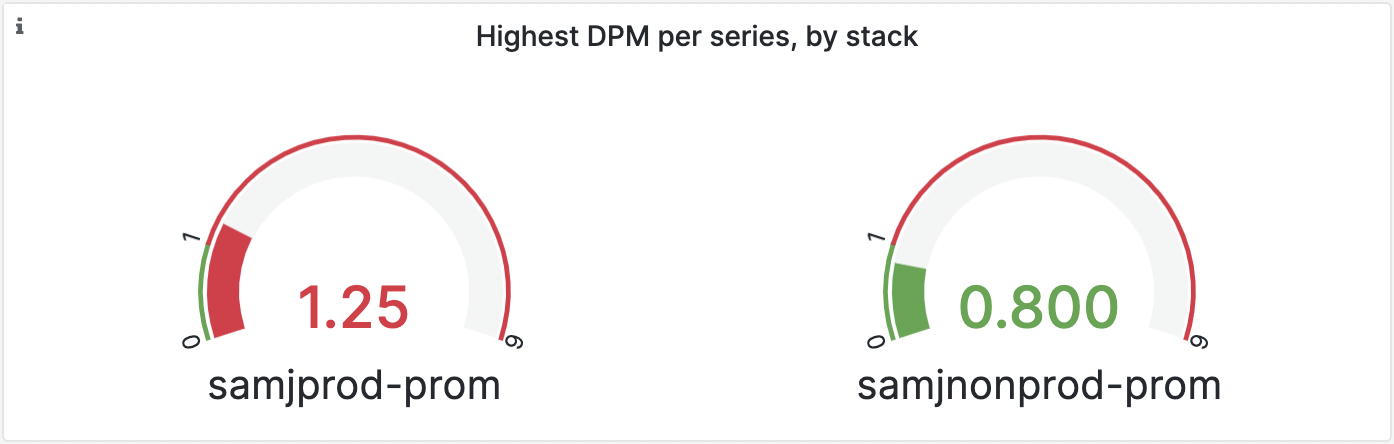
View the panel named Highest DPM by stack.
If any of the gauges show red, then you have a stack that is shipping data points more frequently than are included in your plan.
![“Highest DPM by stack” gauge panel, showing one stack with a red gauge and the other showing a green gauge]()
In this example, the hosted-metrics instance named
samjprod-promis red, showing that it is receiving data points more frequently than the included DPM (which is1in this case).
Reduce your DPM: Change your metrics scrape interval
Your scrape_interval configuration is important because it determines the number of data points per minute (DPM) scraped in your active series.
Depending on how you send metrics to Grafana Cloud, you can reduce your total DPM by adjusting the scrape_interval setting in the Grafana Alloy configuration for
prometheus.scrape or in your Prometheus configuration.
Note
All Grafana Cloud paid plans provide 1 DPM (scrape interval of 60s) resolution at a cost of $6.50 per 1000 active series of additional usage. If you ship metrics at a DPM of 4 (scrape interval of 15s), your cost is
$6.50 * 4 = $26per 1000 active series of additional usage. For more information on DPM and pricing, refer to Active Series and DPM.
Grafana Alloy
The default scrape interval for Grafana Alloy is 60s (1 DPM).
Prometheus
The default scrape interval for Prometheus is 60s (1 DPM).
However, the scrape_interval present in the example configuration file, bundled with the Prometheus download, is set to 15s (4 DPM), so you may find you are already scraping at a higher frequency than the default.
All platforms
As a best practice, set the scrape_interval to 60s (DPM per series of 1).
You can increase or decrease this setting depending on your production needs.
You can also set a job-specific scrape_interval which defaults to the global setting. Use this override to increase the frequency per job when a higher level of granularity is needed.
If you are not sure what your scrape_interval is set to, use the query below in Explore to find the number of times each target was scraped over the last minute. For example, a value of 1 indicates a scrape interval of 1 minute, and a 4 would indicate every 15 seconds. These values (for example 1 and 4) also represent your current DPM per series.
sort_desc(count_over_time(scrape_samples_scraped[1m]))
To increase your scrape_interval , open up your Alloy or Prometheus configuration file and change scrape_interval to 60s.
You can learn more about configuration options as follows:
- Grafana Alloy:
prometheus.scrape - Prometheus:
scrape_config
Next steps
If you are still uncertain and want to share your configuration files with Grafana Labs engineers for review, you can create a support ticket from the Grafana Cloud portal. Be sure to remove any tokens, keys, or sensitive credentials.
Your metrics data source in Grafana Cloud is set to 60s. This means even if you scrape at a higher frequency Grafana will not show more than 1 data point per minute unless you set the scraping interval to the desired value in your data source used by Grafana as well.
To learn more about controlling your Prometheus metrics usage, refer to Control Prometheus metrics usage.
Reduce your DPM: Identify and fix other sources of high DPM
If you have already reduced your scrape interval and are still seeing high DPM, you may have other sources of high DPM.
Check for discarded writes
Discarded samples count towards your total DPM, but do not increase your active series count. Check for these in the Billing/Usage dashboard on the panel named Discarded Metric Samples.
The exception to this rule are samples discarded due to Adaptive Metrics drop rules.
These don’t count towards your total DPM.
They do show up on the Discarded Metrics Samples panel as being discarded for reason requested-by-configuration.
Identify DPM per series for a specific metric
You can identify the DPM per series for any specific metric by using the following query in Explore:
sort_desc(count_over_time({__name__="metric_name"}[1m]))
We recommend starting with the metrics that have highest cardinality and working your way down the list, if you aren’t sure where your high DPM is coming from.
Check for high DPM from recording rules
If your high frequency metrics are not coming directly from Alloy/Prometheus scrapes, then they might be being generated by recording rules. Check the evaluation interval of your recording rules.
If you have recording rules loaded into your Grafana Cloud instance, you can check the evaluation interval of your recording rules by going to Alerting > Alert Rules > edit rule group and then checking the Rule group evaluation interval.
You may also have recording rules defined in any upstream Prometheus instances. Check those by checking the interval within the rule_group configuration. See information about recording rules in the Prometheus documentation for more details.
Check for high DPM from other sources
Lastly, if you are using the Datadog or Graphite proxy, you may find there are high DPM metrics coming from those sources. Check the relevant configurations and documentation.


