
SLI example for availability
This guide provides examples to show how to define availability SLIs based on successful HTTP responses and probe results. The examples explain various methods to define SLIs using distinct Prometheus metric types.
First, it’s important to understand what Grafana SLO expects from an SLI.
Grafana supports event-based SLIs, which measure the ratio of successful events to total events.
The SLI query result must return a ratio between 0 and 1, where
1means100%of events were successful.Grafana expects SLIs to be expressed as a ratio-like query:
numerator / denominator.
Depending on the type of metric, you can calculate the ratio of successful events using counts or rates:
Success ratio = number of successful events (over a period)
                /
total number of events (over a period)Success ratio = rate of successful events (over a period)
/
rate of total events (over a period)Both formulas produce the ratio of successful events, a value between 0 and 1.
In the Grafana SLO wizard, you can create these SLIs using two methods:
- Ratio query builder: Enter a counter metric for success events and a counter metric for total events, and it auto-generates the final SLI query.
- Advanced: Enter the ratio SLI query directly.
HTTP availability (using Prometheus Counter)
HTTP availability is a common SLI for frontend and API services, defining availability as requests that do not return server errors (5xx status codes).
- Number of successful events: All non-5xx requests
- Total number of events: All HTTP requests
This example uses http_requests_total, a Prometheus counter metric that counts the number of HTTP requests by status code, method, and other labels.
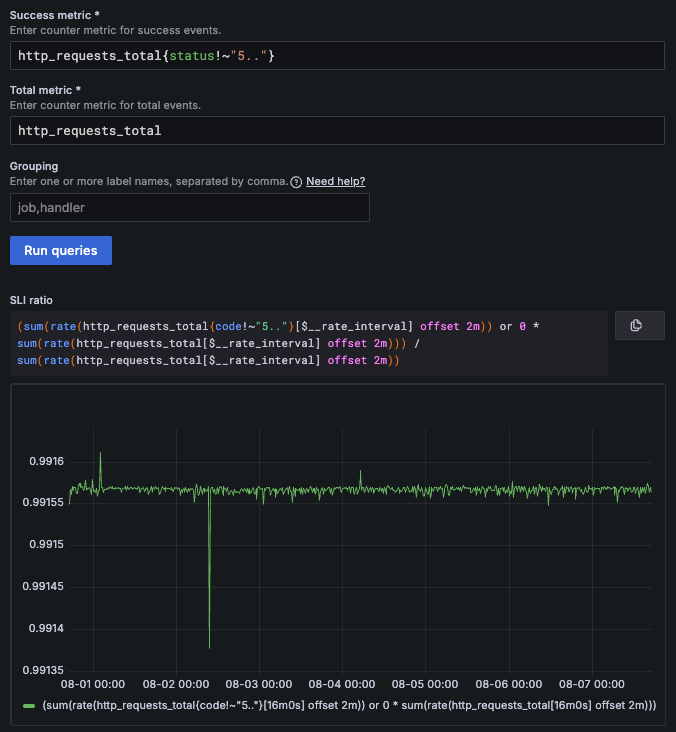
You can get both the number of successful events and the total number of events from this metric, and define the SLI by selecting the Ratio option in the Grafana SLO wizard:
Click Run queries to generate the final SLI ratio query:
(
sum(rate(http_requests_total{status!~"5.."}[$__rate_interval] offset 2m))
or 0 * sum(rate(http_requests_total[$__rate_interval] offset 2m))
)
/
sum(rate(http_requests_total[$__rate_interval] offset 2m))Breakdown of the ratio SLI query
The auto-generated SLI query includes several common elements for building reliable SLIs and uses the ratio of successful event rates formula:
Success ratio = rate of successful events (over a period)
                /
rate of total events (over a period)The SLI query result is a ratio between 0 and 1, where 1 means 100% of events were successful.
Rate of successful events
The following part of the query measures the rate of successful events over the rate interval:
(
  sum(rate(http_requests_total{status!~"5.."}[$__rate_interval] offset 2m))
  or 0 * sum(rate(http_requests_total[$__rate_interval] offset 2m))
)http_requests_total{status!~"5.."}: Returns only successful requests.rate(...[$__rate_interval]): Calculates the per-second rate of successful requests over the recommended rate interval.offset 2m: Shifts the query two minutes into the past to account for scrape or data ingestion delays.sum(...): Aggregates across all series (dimensions) to get the total success rate.or 0 * sum(rate(http_requests_total...)): Fallback for missing data. If the success metric returns no data, it returns 0 when dividing by total events.
This numerator is then divided by the rate of total requests.
Rate of total events
/
sum(rate(http_requests_total[$__rate_interval] offset 2m))
This query follows the rate formula and applies the same offset for alignment with the numerator (rate of successful events).
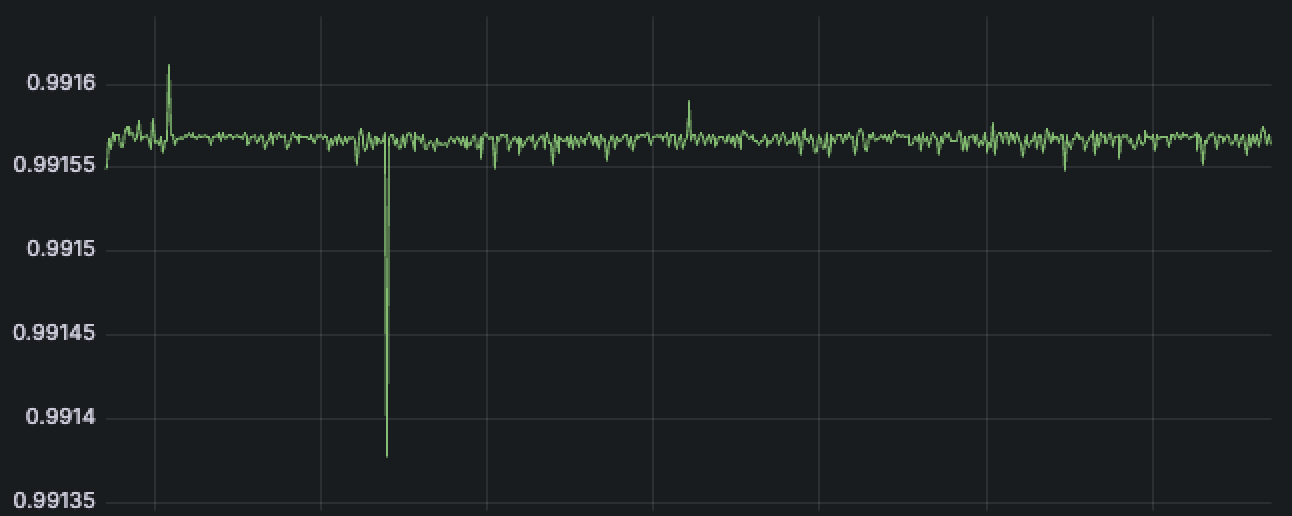
The full query returns a ratio between 0 and 1, representing the proportion of successful requests. The Grafana SLO wizard displays the final SLI query and a graph of its results:
Note that you can also use the Advanced SLI option to create the same SLI query directly.
Probe availability (using Prometheus Summary)
This example uses Synthetic Monitoring probes, such as local probes or Grafana Cloud probes, to verify service availability.
The process is as follows:
Configure a synthetic check from one or more probe locations that continuously verify system availability.
The check runs regularly, based on the configured frequency, and stores its results in Prometheus.
Define an SLO whose SLI queries the Prometheus probe results.
Grafana SLO then evaluates the SLI query and reports the SLO compliance.
This example uses the probe_all_success metric, a summary metric that tracks whether the probe succeeded.
Prometheus summary metrics expose additional *_sum and *_count series. You can use these to get the number of successful events and the total number of events, and define the SLI using the Ratio option in the Grafana SLO wizard:
Click Run queries to generate the final SLI ratio query:
(
  sum(rate(probe_all_success_sum{job="<JOB_NAME>"}[$__rate_interval] offset 2m))
  or 0 * sum(rate(probe_all_success_count{job="<JOB_NAME>"}[$__rate_interval] offset 2m))
)
/
sum(rate(probe_all_success_count{job="<JOB_NAME>"}[$__rate_interval] offset 2m))
The SLI query returns a ratio between 0 and 1, where 1 means 100% of probe executions were successful.
This example works exactly like the HTTP availability example. To learn why the SLI is formed this way and how it works, refer to the breakdown of the ratio SLI query .
Probe availability (using Prometheus Gauge)
Sometimes, a binary gauge metric is used to track successes, such as the probe_success metric.
probe_successis1on success.probe_successis0on failure.
In the SLO wizard, the Ratio option expects a counter metric and cannot generate the correct ratio SLI for this case. Use the Advanced query option instead.
Define an SLI that returns the ratio of successes, represented as a value between 0 and 1, as in the previous examples. You can use the ratio of successful events formula for this SLI:
Success ratio = number of successful events (over a period)
                /
                total number of events (over a period)
The SLI can then be defined as follows:
# `sum_over_time` sums the 1s to calculate the number of successful probes
sum(sum_over_time(probe_success{job="<JOB_NAME>"}[$__interval]))
/
sum(count_over_time(probe_success{job="<JOB_NAME>"}[$__interval]))
# `count_over_time` counts the total number of probe executions (1=success, 0=failure)probe_success{job="<JOB_NAME>"}: Returns probe results for the specified job. Each sample is either1(success) or0(failure).sum_over_time(...[$__interval]): Sums the values of successful probes over the given interval; failed probes are counted as0.count_over_time(...[$__interval]): Counts all probe executions in the given interval, including both successes (1) and failures (0).sum(...): Aggregates across all series (dimensions) to get the total number of successful probes and total probe executions.
Like the other SLI examples, this SLI returns a value between 0 and 1, representing the ratio of successful executions.
Note
$__rate_intervalis recommended for calculatingrate()in other examples. When you use other_over_time()functions that don’t require at least two data points, it’s better to use$__intervalto achieve finer error budget resolution by evaluating SLIs at smaller time intervals.
Availability using failure metric
Sometimes, you might have a metric that counts failures instead of successes, because your instrumentation doesn’t use a single metric with a label indicating success or failure.
For example, you may only have the following counters:
failure_total: Counts failed requests or operations.all_total: Counts all requests or operations.
In this case, you can calculate availability by subtracting failures from the total:
Success ratio = (total events - failed events)
                /
                total events
Avoid using 1 - (<failure rate> / <total rate>) because the SLI can’t be parsed as a ratio-like query.
In the Grafana SLO wizard, use the Advanced option:
# rate of successful events
(
  sum(rate(all_total[$__rate_interval]))
  -
  sum(rate(failure_total[$__rate_interval]))
)
/
sum(rate(all_total[$__rate_interval]))
# rate of total events
The SLI query result is still the same: a ratio between 0 and 1, where 1 means 100% of events were successful.


