
SLO reports
SLO reports help you monitor and evaluate multiple service level objectives (SLOs). They display the performance of multiple SLOs in a single view, making it easier to track reliability trends over time and understand how SLOs perform together.
With SLO reports, you can:
- View multiple SLOs in one place, and review SLO performance trends for a given period.
- Review combined SLI and error budget results calculated across all events from all SLOs.
- Review per-SLO results, including the current SLI value, remaining error budget, and weighted impact to understand how each SLO contributes to the combined results.
- Navigate to the SLO dashboard for detailed results.
Note
SLO reports support only event-based SLOs.
Event-based SLOs calculate the SLI by comparing successful events to total events, and define their SLIs as ratio-like queries (
numerator / denominator). For more details, refer to SLI examples.
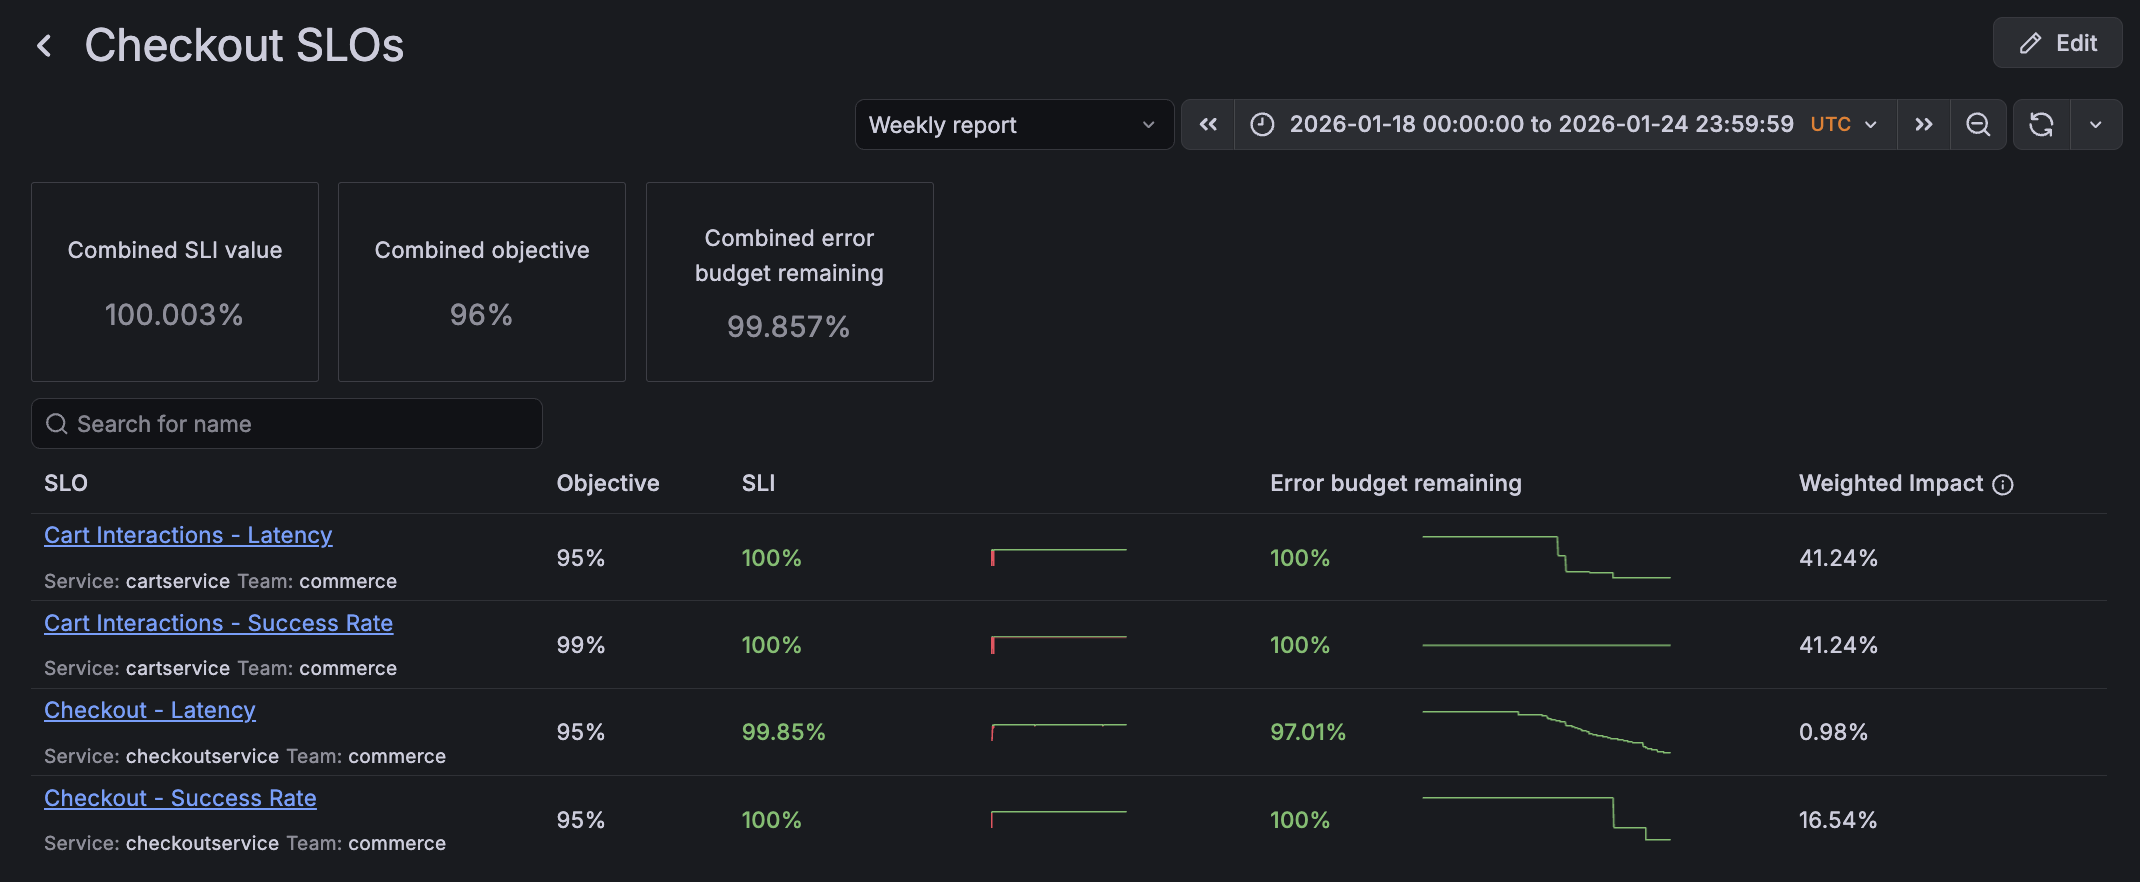
Report view
For the selected period, the SLO report view includes a summary of the combined results across all SLOs, and a table listing the results of individual SLOs.
The summary section displays combined SLO results calculated across all events from all SLOs in the report:
- Combined SLI value: The success ratio across all events from all SLOs.
- Combined objective: The average objective across all SLOs.
- Combined error budget remaining: The remaining error budget calculated from all events across all SLOs.
The SLO table shows individual SLO results, including a sparkline for the SLI over time, and the remaining error budget at the end of the selected period. For details about how these values are calculated, refer to the SLO dashboard.
Weighted impact
The Weighted impact property represents how much the SLO contributes to the combined results in the summary section.
All SLOs in the report are event-based. When combining results across all SLOs, the weighted impact of an SLO is the proportion of its events relative to all events across all SLOs. It is calculated as:
number of events for the SLO / total number of events across all SLOs
Time range selection
The report displays data for the time range selected in the time picker.
When you open the report, the time range is based on the Time window setting of the SLO report:
- Weekly report: the last complete Sunday-to-Sunday week.
- Monthly report: the current calendar month.
You can change the time range using the time picker or dropdown options to view SLO results for a different period. The summary and SLO table update automatically.
Create a report
To create a new report:
From the sidebar, select Alerts & IRM > SLO > Reports
Click Create Report.
Select one or more SLOs to include.
(Optional) Add a description.
Choose a default Time window for the SLO report.
Select Monthly or Weekly to set the default reporting period.
In the Report view, you can select a custom date range to view the SLO report for a specific period.
Click Create.
After saved, the report calculates historical data for the selected period and SLOs.


