Create SLOs
Create service level objectives (SLOs) to measure the quality of service you provide to your users.
Each SLO includes a service level indicator (SLI), a target, and a time window. You can also add alert rules to receive notifications when the SLO is at risk of being breached.
In the following sections, you create an SLO by completing these steps:
- Set the time window
- Define a service level indicator
- Set a target and error budget
- Add a name and description
- Add SLO alert rules
- Review and save your SLO
Supported SLO data sources
You can define SLOs without moving your telemetry data into Grafana Cloud.
To define the SLI, you can query the following data sources configured in your Grafana Cloud instance:
- Mimir (Prometheus-compatible)
- Splunk
- AppDynamics
- Graphite
- Multi-stack data sources are not currently available.
Alternatively you can use Grafana-managed recording rules to generate recorded metrics from additional data sources in Mimir (Prometheus-compatible), and then query the recorded Prometheus metric in your SLI.
Set the time window
Start by defining the SLO time window.
The time window defines the entire period over which the SLO is evaluated.
Note
SLOs are evaluated over long periods, rather than short intervals.
While the SLI is calculated over short intervals, the SLO evaluates those results over the entire time window.
The minimum SLO time window is 7 days.
The default time window is 28 days. This ensures a consistent number of weekends, no matter what day of the week it is. This accounts better for traffic variation over weekends than a 30-day window.
To create your SLO:
Click Alerts & IRM -> SLO + Create SLO.
Enter time window.
Enter the period of days over which to evaluate the SLO.
Define a service level indicator
A service level indicator (SLI) is the metric that defines how the SLO measures the quality or reliability of your service.
The SLI defines the success criteria for your service reliability. For example:
- Latency: requests respond within 2 seconds.
- Availability: requests do not return system errors.
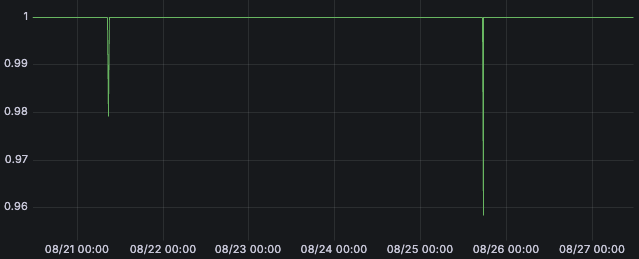
The SLI must define a query that returns the success ratio for the given reliability criteria. It must return a value between 0 and 1 for each evaluation period, where 1 represents 100% success and 0 represents 0% success.
You can define the SLI query using two options:
Ratio query
Use this option to create an SLI from a success metric and a total metric, derived from Prometheus counter metrics.
This option does not require writing the full PromQL expression. It generates the complete SLI query, including fallbacks for more reliable SLIs.
The following examples use the Ratio query option:
- HTTP availability example (Prometheus Counter)
- Probe latency example (Prometheus Classic Histogram)
- Multi-dimensional probe example (Prometheus Classic Histogram)
Advanced query
Use this option to write a custom query. You can use the graphical query builder or enter the query manually.
Note
For all SLO features to work, the SLI query must be expressed as a ratio:
numerator / denominator.
The following examples use the Advanced query option:
Set a target and error budget
Set the target as a percentage (99%, 98%, 95%, …) to define the acceptable performance level for the service over the time window.
For example, given a latency SLI, you can set a 99.5% target to define the SLO as follows:
- 99.5% of requests should respond within 2 seconds over a 28-day period.
The error budget is automatically calculated as 100% - SLO target. It’s the amount of error your service can accumulate over the time window before breaching the SLO.
For example, a service with an SLO of 99.5% has an error budget of 0.5%, which means:
- Up to 0.5% of requests can fail in total over a 28-day period.
A service meets its objective when it achieves this target, meaning the error budget has not been exceeded.
Statistical predictions
After you enter a target, Grafana SLO queries 90 days of historical data from the raw metrics used by the SLI query. It then simulates many scenarios and provides a distribution of likely outcomes over the objective window.
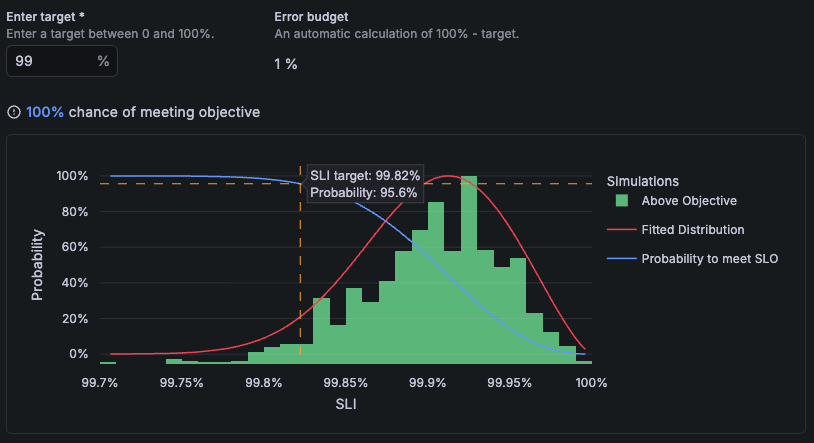
Use this prediction to validate your SLO configuration and goals:
- At the top of the chart, the prediction shows the probability of meeting the entered target.
- In the histogram, you can hover to see the probability of meeting your SLO for different targets.
Note
In some cases, predictions cannot be generated. When this happens, this chart displays the remaining error budget panel based on the provided SLI query.
Add a name and description
Give your SLO a name. You can also add an optional description and labels to provide more context for understanding and management.
SLO names identify your SLO in dashboards and alert rules.
Add a name for your SLO.
Make sure the name is short and meaningful, so anyone can tell what it measures at a glance.
Add a description for your SLO.
Make sure the description clearly explains what the SLO measures and why it’s important.
Add SLO labels.
Add
teamorservicelabels to define SLO ownership. You can also add custom labels.Labels can be used to route SLO alert notifications.
Good SLO names, descriptions, and labeling practices are a critical part of SLO maintenance and alignment.
Add SLO alert rules
Enable SLO alert rules to receive notifications and act proactively before the SLO is breached.
In Grafana SLO, you can enable two types of alert rules:
Fast-burn alerts
Evaluate short time periods and fire when the error budget is consumed quickly.
This predicts that the error budget would be consumed over minutes or hours. It alerts you to serious conditions, such as outages or hardware failures.
Slow-burn alerts
Evaluate longer time periods and fire when the error budget is consumed gradually.
This predicts that the error budget would be consumed over hours or days. It alerts you to ongoing issues that require attention.
In the alert rule settings, you can configure the following options:
- Edit the name and description of the alert rules.
- Add labels for alert routing.
- Add annotations, such as runbooks, to provide additional context to responders.
- Set the minimum failure threshold, the minimum number of failure events required to trigger the alert.
Note
SLO alert rules are not created until you save your SLO.
After saving, you can continue configuring alert rules in configure burn-rate notifications.
Review and save your SLO
Review each section of your SLO. When you’re satisfied, save it to create the SLO.
Additional generated resources
When you create an SLO, Grafana generates the following resources and places them in the same folder as the SLO:
SLO dashboard: display SLO results, including SLI performance and error budget consumption.
Recording rules: optimize queries used to calculate the SLI and error budget.
(Optional) Alert rules: trigger notifications based on the configured SLO alert conditions.
If any of these resources are deleted, Grafana automatically recreates them to ensure that you don’t miss alerts or lose access SLO dashboards.


