View active notifications
The Active notifications page lists groups of alerts (or alert instances) that are actively triggering notifications.
By default, Grafana Alerting groups similar alerts into a single notification.
In this view, you can:
- Find alert groups and the state of their notifications.
- Filter for alert instances that match specific criteria.
The Active notifications view is useful for debugging and verifying how notifications are grouped based on your notification policy settings.
View alert groups and notification state
To view alert groups, complete the following steps.
Click Alerts & IRM -> Alerting -> Alert activity.
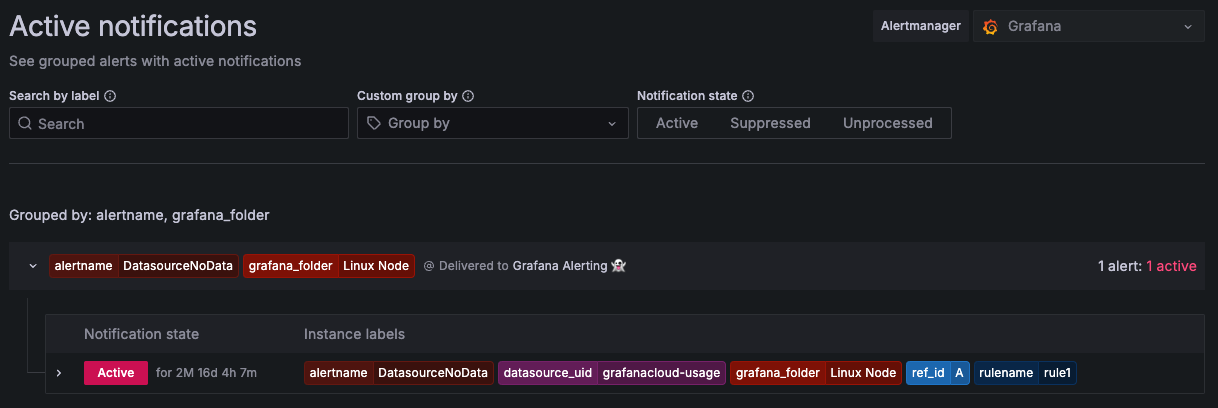
Select the Active notifications tab to view the list of groups firing notifications.
![Active notifications view in Grafana Alerting]()
By default, alert groups are grouped by the notification policies grouping.
Each group displays its label set, contact point, and the number of alert instances (or alerts).
Then, click on a group to access its alert instances. You can find alert instances by their label set and view their notification state.
Notification states
The notification state of an alert instance can be in one of the following states:
- Unprocessed: The alert is received but its notification has not been processed yet.
- Suppressed: The alert has been silenced.
- Active: The alert notification has been handled. The alert is still firing and continues to be managed.
Filter alerts
You can filter by label, state, or Alertmanager:
By label: In Search, enter an existing label to view alerts matching the label. For example,
environment=production,region=~US|EU,severity!=warning.By state: In States, select from Active, Suppressed, or Unprocessed states to view alerts matching your selected state. All other alerts are hidden.
By Alertmanager: In the Alertmanager dropdown, select an external Alertmanager to view only alert groups for that specific Alertmanager. By default, the
GrafanaAlertmanager is selected.
Custom group
From Custom group by dropdown, select a combination of labels to view a grouping other than the default. This helps validate the grouping settings of your notification policies.
If an alert does not contain labels specified either in the grouping of the default policy or the custom grouping, then the alert is added to a catch all group with a header of No grouping.
View notification errors
Note
Notification errors are only available with pre-configured Grafana Alertmanagers.
Notification errors provide information about why they failed to be sent or were not received.
To view notification errors, navigate to Alerts & IRM -> Alerting -> Notification configuration, then select the Contact points tab.
Each contact point displays a message about the status of their latest notification deliveries.
If a contact point is failing, a red message indicates that there are errors delivering notifications. Hover over the error message to see the notification error details.
Was this page helpful?
Related resources from Grafana Labs


