
No Data and Error states
Grafana Alerting implements the No Data and Error states to handle common scenarios when evaluating alert rules, and you can modify their behavior.
An alert instance can transition to these special states:
- No Data state occurs when the alert rule query runs successfully but returns no data points.
- Error state occurs when the alert rule fails to evaluate its query or queries successfully.
Note
No Data and Error states are supported only for Grafana-managed alert rules.
Tip
For common examples and practical guidance on handling Error, No Data, and stale alert scenarios, refer to the Handle connectivity errors and Handle missing data guides.
Alert instance states
A Grafana-managed alert instance can be in any of the following states, depending on the outcome of the alert rule evaluation:

Error state
The Error state is triggered when the alert rule fails to evaluate its query or queries successfully.
This can occur due to evaluation timeouts (default: 30s) or repeated failures (default: 3) when querying the data source. The
evaluation_timeout and
max_attempts options control these settings.
When an alert instance enters the Error state, Grafana, by default, triggers a new DatasourceError alert. You can control this behavior based on the desired outcome of your alert rule in Modify the No Data or Error state.
No Data state
The No Data state occurs when the alert rule query runs successfully but returns no data points at all.
When an alert instance enters the No Data state, Grafana, by default, triggers a new DatasourceNoData alert. You can control this behavior based on the desired outcome of your alert rule in Modify the No Data or Error state.
Modify the No Data or Error state
These states are supported only for Grafana-managed alert rules.
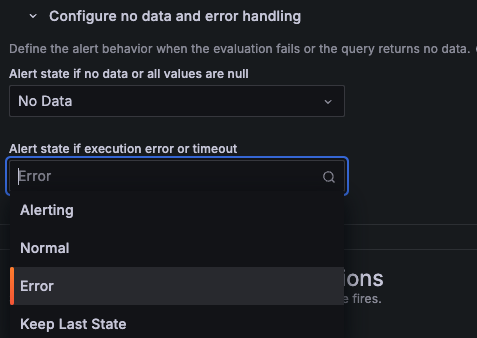
In Configure no data and error handling, you can change the default behavior when the evaluation returns no data or an error. You can set the alert instance state to Alerting, Normal, Error, or Keep Last State.
Note that when you configure the No Data or Error behavior to Alerting or Normal, Grafana attempts to keep a stable set of fields under notification Values. If your query returns no data or an error, Grafana re-uses the latest known set of fields in Values, but will use -1 in place of the measured value.
Keep last state
The “Keep Last State” option helps mitigate temporary data source issues, preventing alerts from unintentionally firing, resolving, and re-firing.
However, in situations where strict monitoring is critical, relying solely on the “Keep Last State” option may not be appropriate. Instead, consider using an alternative or implementing additional alert rules to ensure that issues with prolonged data source disruptions are detected.
No Data and Error alerts
When an alert rule evaluation results in a No Data or Error state, Grafana Alerting immediately creates a new alert instance —skipping the pending period—with the following additional labels:
alertname: EitherDatasourceNoDataorDatasourceErrordepending on the state.datasource_uid: The UID of the data source that caused the state.rulename: The name of the alert rule that originated the alert.
Note that DatasourceNoData and DatasourceError alert instances are independent from the original alert instance. They have different labels, which means existing silences, mute timings, and notification policies applied to the original alert may not apply to them.
You can manage these alerts like regular ones by using their labels to apply actions such as adding a silence, routing via notification policies, and more.
If the alert rule is configured to send notifications directly to a selected contact point (instead of using notification policies), the DatasourceNoData and DatasourceError alerts are also sent to that contact point. Any additional notification settings defined in the alert rule, such as muting or grouping, are preserved.
Reduce No Data or Error alerts
To minimize the number of No Data or Error state alerts received, try the following.
Use the Keep last state option. For more information, refer to the section below. This option allows the alert to retain its last known state when there is no data available, rather than switching to a No Data state.
For No Data alerts, you can optimize your alert rule by expanding the time range of the query. However, if the time range is too big, it affects the performance of the query and can lead to errors due to timeout.
To minimize timeouts resulting in the Error state, reduce the time range to request less data every evaluation cycle.
To reduce multiple notifications from Error alerts, define a notification policy to handle all related alerts with
alertname=DatasourceError, and filter and group errors from the same data source using thedatasource_uidlabel.Change the evaluation timeout (default:
30s) or the retry mechanism (max_attempts) settings. This should be a last resort, as it can affect the performance of all alert rules and may cause missed evaluations if the timeout is too long. For Grafana Cloud, open a support ticket from the Cloud Portal.Tip
For common examples and practical guidance on handling Error, No Data, and stale alert scenarios, refer to the Handle connectivity errors and Handle missing data guides.
grafana_state_reason for troubleshooting
Occasionally, an alert instance may be in a state that isn’t immediately clear to everyone. For example:
- If “no data” handling is configured to transition to a state other than
No Data. - If “error” handling is configured to transition to a state other than
Error. - If the alert rule is deleted, paused, or updated in some cases, the alert instance also transitions to the
Normalstate. - Stale alert instances in the
Alertingstate transition to theNormalstate when the series disappear.
In these situations, the evaluation state may differ from the alert state, and it might be necessary to understand the reason for being in that state when receiving the notification.
The grafana_state_reason annotation is included in these situations, providing the reason that explains why the alert instance transitioned to its current state. For example:
- If “no data” or “error” handling transitions to the
Normalstate, thegrafana_state_reasonannotation is included with the value No Data or Error, respectively. - If the alert rule is deleted or paused, the
grafana_state_reasonis set to Paused or RuleDeleted. For some updates, it is set to Updated. - Stale alert instances in the
Normalstate include thegrafana_state_reasonannotation with the value MissingSeries.


