Important: This documentation is about an older version. It's relevant only to the release noted, many of the features and functions have been updated or replaced. Please view the current version.
Use Grafana Alloy to send metrics to Prometheus
In the previous tutorial, you learned how to configure Alloy to collect and process logs from your local machine and send them to Loki.
This tutorial shows you how to configure Alloy to collect and process metrics from your local machine, send them to Prometheus, and use Grafana to explore the results.
Before you begin
To complete this tutorial:
- You must have a basic understanding of Alloy and telemetry collection in general.
- You should be familiar with Prometheus, PromQL, Loki, LogQL, and basic Grafana navigation.
- You must complete the previous tutorial to prepare the following prerequisites:
- Install Alloy and start the service in your environment.
- Set up a local Grafana instance.
- Create a
config.alloyfile.
Tip
Alternatively, you can try out this example in our interactive learning environment: Sending metrics to Prometheus.
It’s a fully configured environment with all the dependencies already installed.

Configure Alloy
In this tutorial, you configure Alloy to collect metrics and send them to Prometheus.
You add components to your config.alloy file to tell Alloy which metrics you want to scrape, how you want to process that data, and where you want the data sent.
The following steps build on the config.alloy file you created in the previous tutorial.
First component: Scraping
Paste the following component configuration at the top of your config.alloy file:
prometheus.exporter.unix "local_system" { }

prometheus.scrape "scrape_metrics" {
  targets         = prometheus.exporter.unix.local_system.targets
  forward_to      = [prometheus.relabel.filter_metrics.receiver]
  scrape_interval = "10s"
}
This configuration creates a prometheus.scrape component named scrape_metrics which does the following:
- It connects to the
local_systemcomponent as its source or target. - It forwards the metrics it scrapes to the receiver of another component called
filter_metrics. - It tells Alloy to scrape metrics every 10 seconds.
Second component: Filter metrics
Filtering non-essential metrics before sending them to a data source can help you reduce costs and allow you to focus on the data that matters most.
The following example demonstrates how you can filter out or drop metrics before sending them to Prometheus.
Paste the following component configuration below the previous component in your config.alloy file:
prometheus.relabel "filter_metrics" {
  rule {
    action        = "drop"
    source_labels = ["env"]
    regex         = "dev"
  }

  forward_to = [prometheus.remote_write.metrics_service.receiver]
}
The prometheus.relabel component is commonly used to filter Prometheus metrics or standardize the label set passed to one or more downstream receivers.
You can use this component to rewrite the label set of each metric sent to the receiver.
Within this component, you can define rule blocks to specify how you would like to process metrics before they’re stored or forwarded.
This configuration creates a prometheus.relabel component named filter_metrics which does the following:
- It receives scraped metrics from the
scrape_metricscomponent. - It tells Alloy to drop metrics that have an
"env"label equal to"dev". - It forwards the processed metrics to the receiver of another component called
metrics_service.
Third component: Write metrics to Prometheus
Paste the following component configuration below the previous component in your config.alloy file:
prometheus.remote_write "metrics_service" {
    endpoint {
        url = "http://localhost:9090/api/v1/write"

        // basic_auth {
        //   username = "admin"
        //   password = "admin"
        // }
    }
}
This final component creates a prometheus.remote_write component named metrics_service that points to http://localhost:9090/api/v1/write.
This completes the simple configuration pipeline.
Tip
The
basic_authis commented out because the localdocker composestack doesn’t require it. It’s included in this example to show how you can configure authorization for other environments.For further authorization options, refer to the
prometheus.remote_writecomponent documentation.
This connects directly to the Prometheus instance running in the Docker container.
Reload the configuration
Copy your local config.alloy file into the default Alloy configuration file location.
sudo cp config.alloy $(brew --prefix)/etc/alloy/config.alloysudo cp config.alloy /etc/alloy/config.alloyCall the /-/reload endpoint to tell Alloy to reload the configuration file without a system service restart.
curl -X POST http://localhost:12345/-/reloadTip
This step uses the Alloy UI, on
localhostport12345. If you choose to run Alloy in a Docker container, make sure you use the--server.http.listen-addr=0.0.0.0:12345argument.If you don’t use this argument, the debugging UI won’t be available outside of the Docker container.
Optional: You can do a system service restart Alloy and load the configuration file:
brew services restart alloysudo systemctl reload alloyInspect your configuration in the Alloy UI
Open http://localhost:12345 and click the Graph tab at the top. The graph should look similar to the following:
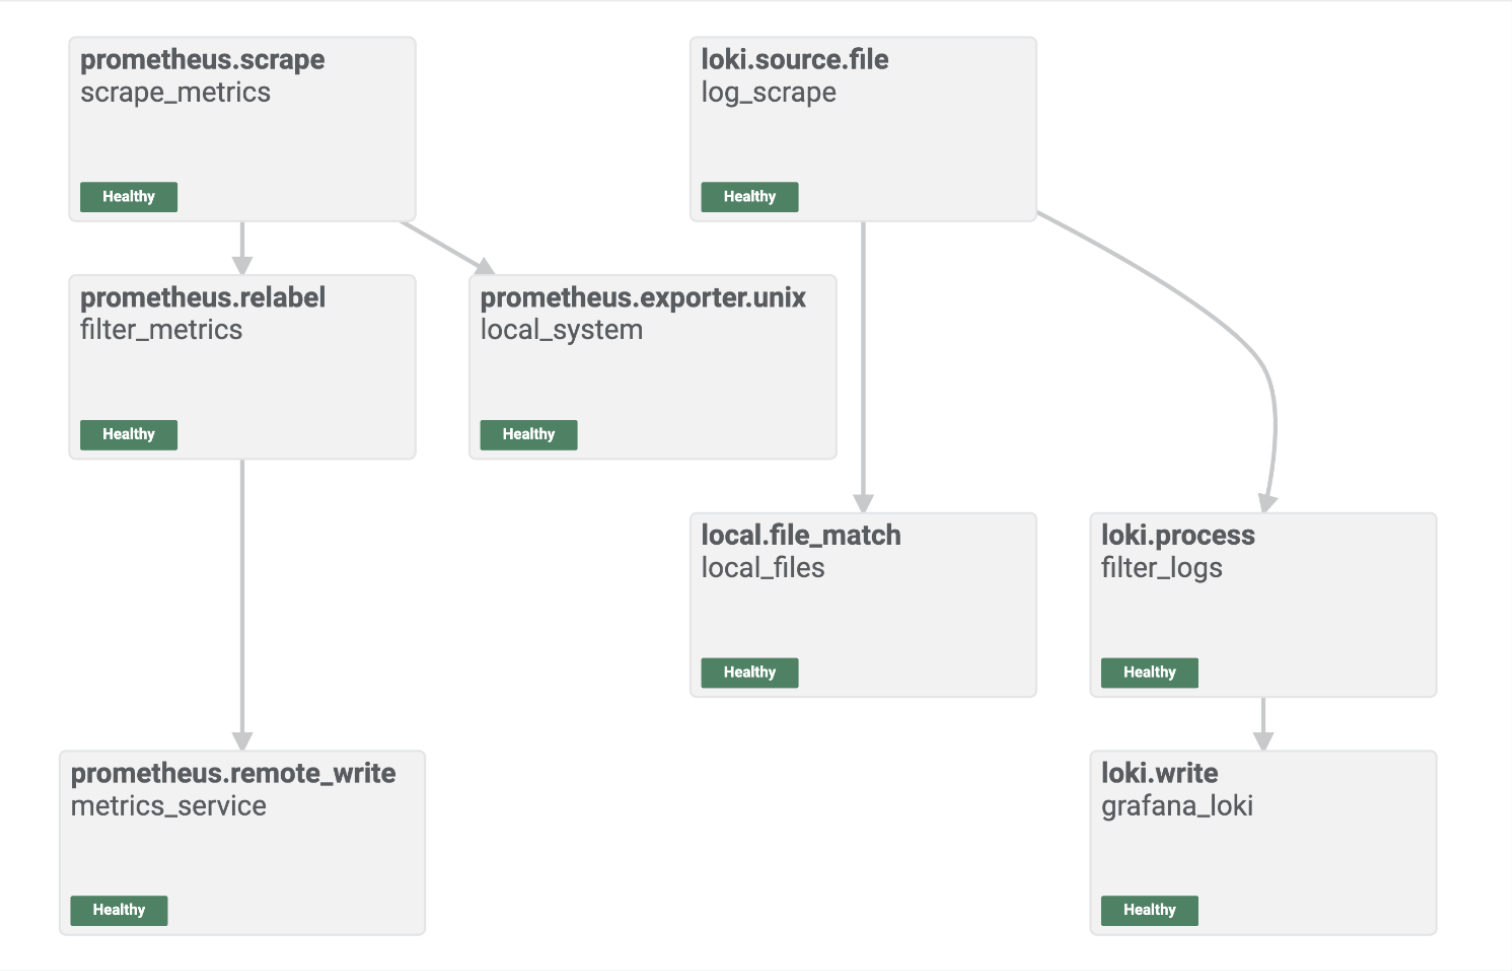
The Alloy UI shows you a visual representation of the pipeline you built with your Alloy component configuration.
You can see that the components are healthy, and you are ready to explore the metrics in Grafana.
Log into Grafana and explore metrics in Prometheus
Open http://localhost:3000/explore/metrics/ to access the Explore Metrics feature in Grafana.
From here you can visually explore the metrics that are being sent to Prometheus by Alloy.
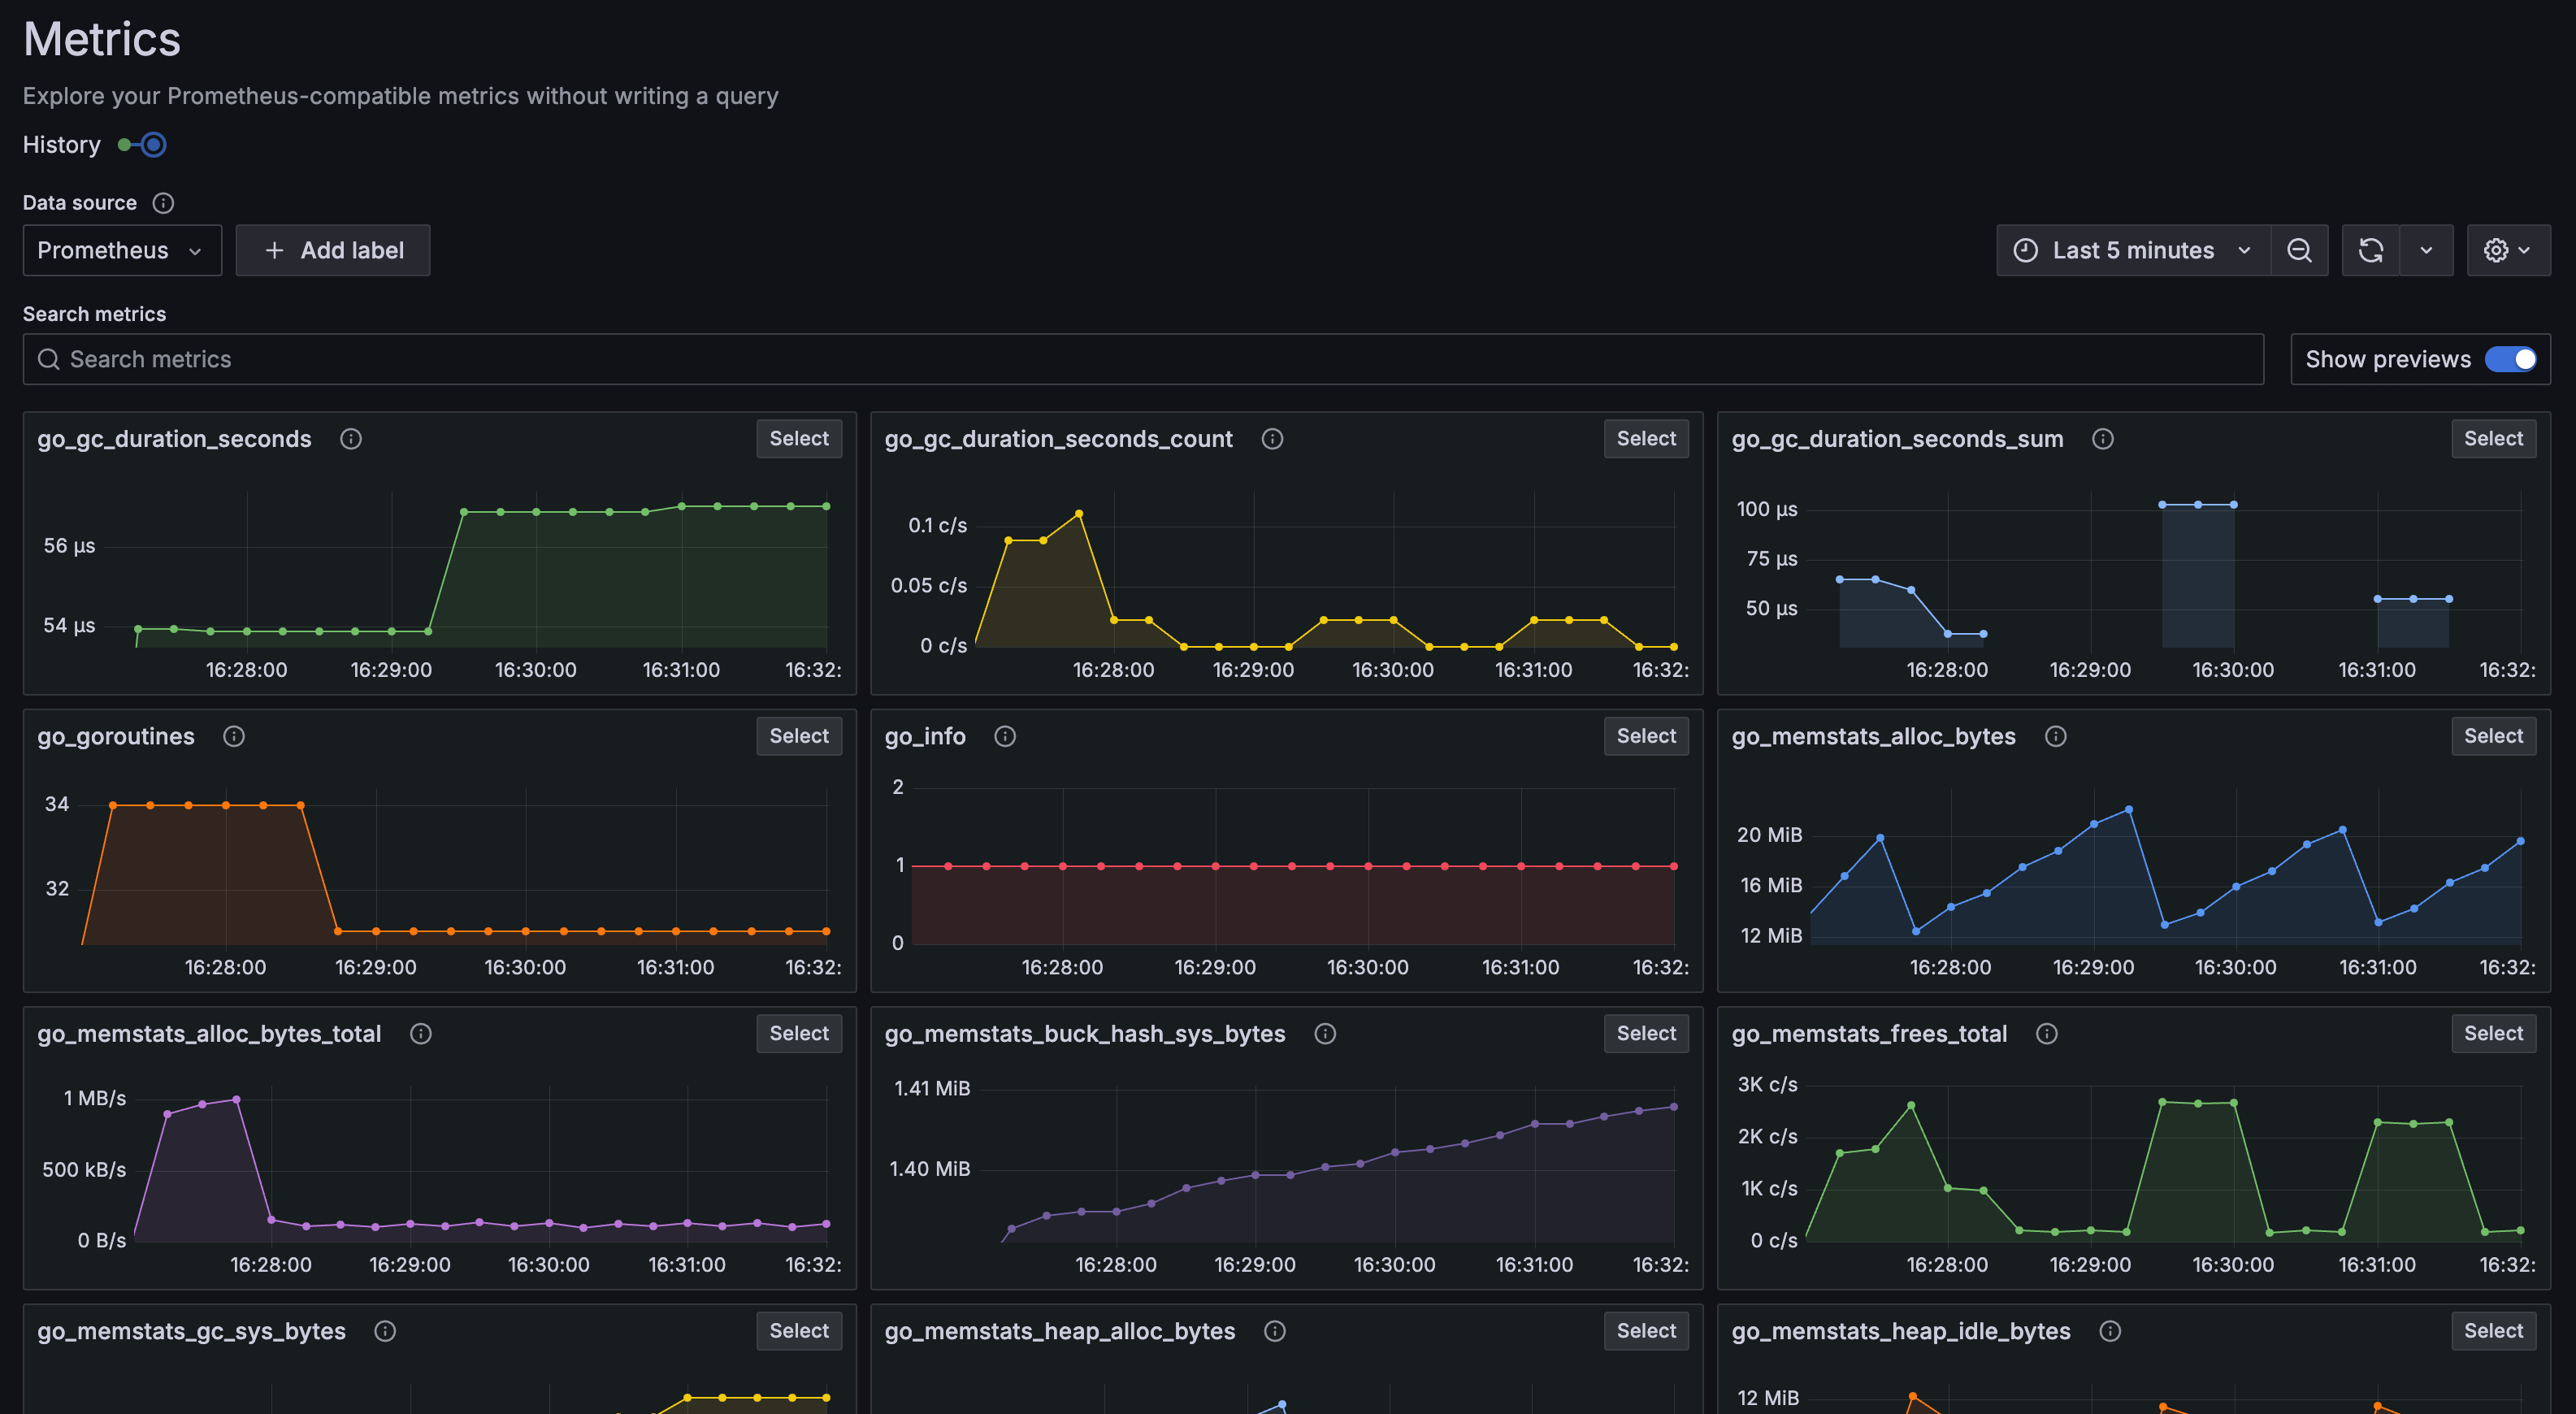
You can also build promQL queries manually to explore the data further.
Open http://localhost:3000/explore to access the Explore feature in Grafana.
Select Prometheus as the data source and click the Metrics Browser button to select the metric, labels, and values for your labels.
Here you can see that metrics are flowing through to Prometheus as expected, and the end-to-end configuration was successful.
Summary
You have configured Alloy to collect and process metrics from your local host and send them to your local Grafana stack.


