
Caution
Grafana Alloy is the new name for our distribution of the OTel collector. Grafana Agent has been deprecated and is in Long-Term Support (LTS) through October 31, 2025. Grafana Agent will reach an End-of-Life (EOL) on November 1, 2025. Read more about why we recommend migrating to Grafana Alloy.
Logs and relabeling basics
This tutorial assumes you have completed the First components and introducing the standard library tutorial, or are at least familiar with the concepts of components, attributes, and expressions and how to use them. You will cover some basic metric relabeling, followed by how to send logs to Loki.
Relabel metrics
Recommended reading
- Optional: prometheus.relabel
Before moving on to logs, let’s look at how we can use the prometheus.relabel component to relabel metrics. The prometheus.relabel component allows you to perform Prometheus relabeling on metrics and is similar to the relabel_configs section of a Prometheus scrape config.
Let’s add a prometheus.relabel component to a basic pipeline and see how to add labels.
prometheus.exporter.unix "localhost" { }

prometheus.scrape "default" {
    scrape_interval = "10s"

    targets    = prometheus.exporter.unix.localhost.targets
    forward_to = [
        prometheus.relabel.example.receiver,
    ]
}

prometheus.relabel "example" {
    forward_to = [
        prometheus.remote_write.local_prom.receiver,
    ]

    rule {
        action       = "replace"
        target_label = "os"
        replacement  = constants.os
    }
}

prometheus.remote_write "local_prom" {
    endpoint {
        url = "http://localhost:9090/api/v1/write"
    }
}
We have now created the following pipeline:

This pipeline has a prometheus.relabel component that has a single rule.
This rule has the replace action, which will replace the value of the os label with a special value: constants.os.
This value is a special constant that is replaced with the OS of the host Grafana Agent is running on.
You can see the other available constants in the
constants documentation.
This example has one rule block, but you can have as many as you want.
Each rule block is applied in order.
If you run Grafana Agent and navigate to localhost:3000/explore, you can see the os label on the metrics. Try querying for node_context_switches_total and look at the labels.
Relabeling uses the same rules as Prometheus. You can always refer to the prometheus.relabel documentation for a full list of available options.
Note
You can forward multiple components to one
prometheus.relabelcomponent. This allows you to apply the same relabeling rules to multiple pipelines.
Warning
There is an issue commonly faced when relabeling and using labels that start with
__(double underscore). These labels are considered internal and are dropped before relabeling rules from aprometheus.relabelcomponent are applied. If you would like to keep or act on these kinds of labels, use a discovery.relabel component.
Send logs to Loki
Recommended reading
- Optional: local.file_match
- Optional: loki.source.file
- Optional: loki.write
Now that you’re comfortable creating components and chaining them together, let’s collect some logs and send them to Loki. We will use the local.file_match component to perform file discovery, the loki.source.file to collect the logs, and the loki.write component to send the logs to Loki.
Before doing this, we need to ensure we have a log file to scrape. We will use the echo command to create a file with some log content.
mkdir -p /tmp/flow-logs
echo "This is a log line" > /tmp/flow-logs/log.log
Now that we have a log file, let’s create a pipeline to scrape it.
local.file_match "tmplogs" {
    path_targets = [{"__path__" = "/tmp/flow-logs/*.log"}]
}

loki.source.file "local_files" {
    targets    = local.file_match.tmplogs.targets
    forward_to = [loki.write.local_loki.receiver]
}

loki.write "local_loki" {
    endpoint {
        url = "http://localhost:3100/loki/api/v1/push"
    }
}
The rough flow of this pipeline is:

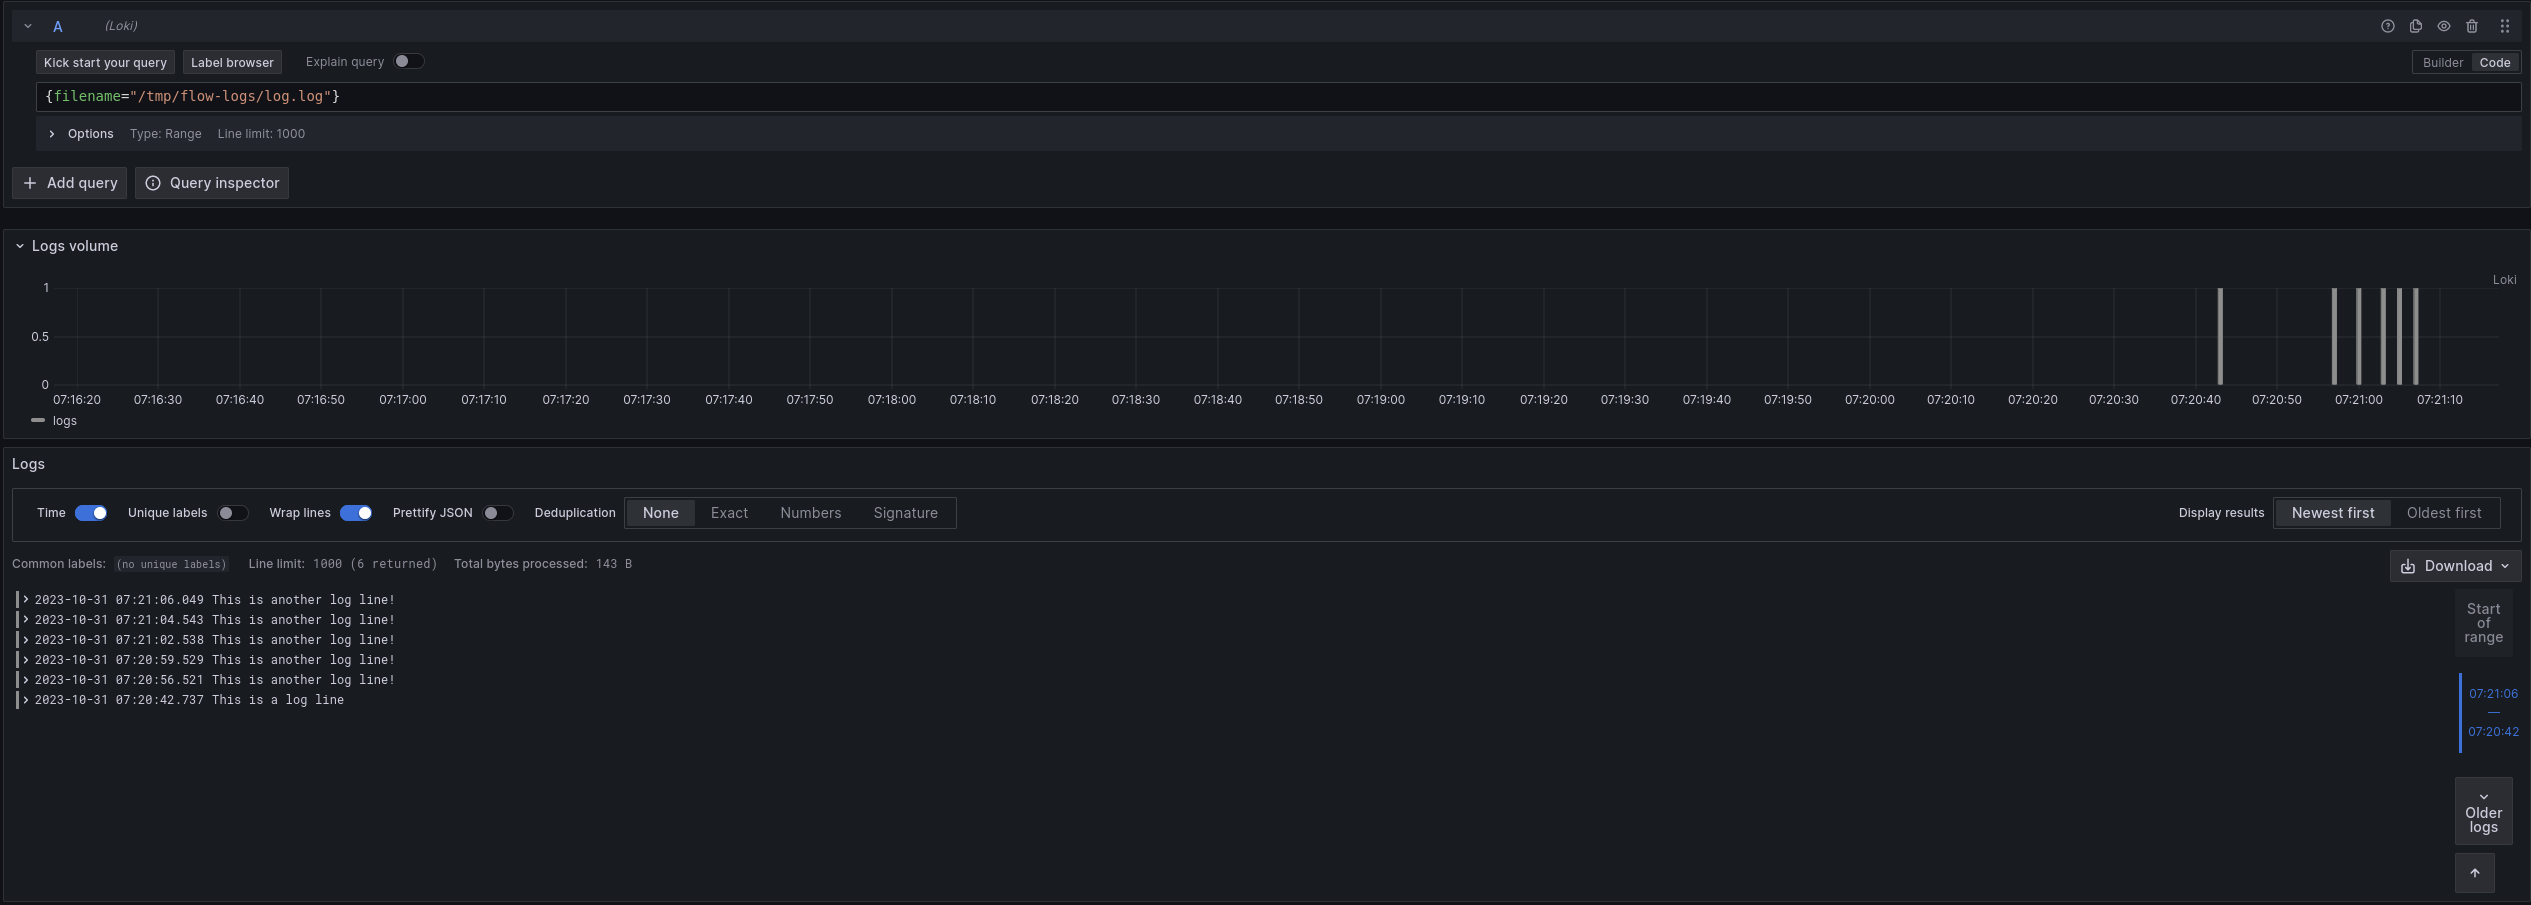
If you navigate to localhost:3000/explore and switch the Datasource to Loki, you can query for {filename="/tmp/flow-logs/log.log"} and see the log line we created earlier. Try running the following command to add more logs to the file.
echo "This is another log line!" >> /tmp/flow-logs/log.logIf you re-execute the query, you can see the new log lines.
If you are curious how Grafana Agent keeps track of where it is in a log file, you can look at data-agent/loki.source.file.local_files/positions.yml.
If you delete this file, Grafana Agent starts reading from the beginning of the file again, which is why keeping the Grafana Agent’s data directory in a persistent location is desirable.
Exercise
Recommended reading
Add a Label to Logs
This exercise will have two parts, building on the previous example. Let’s start by adding an os label (just like the Prometheus example) to all of the logs we collect.
Modify the following snippet to add the label os with the value of the os constant.
local.file_match "tmplogs" {
    path_targets = [{"__path__" = "/tmp/flow-logs/*.log"}]
}

loki.source.file "local_files" {
    targets    = local.file_match.tmplogs.targets
    forward_to = [loki.write.local_loki.receiver]
}

loki.write "local_loki" {
    endpoint {
        url = "http://localhost:3100/loki/api/v1/push"
    }
}
Note
You can use the loki.relabel component to relabel and add labels, just like you can with the prometheus.relabel component.
Once you have your completed configuration, run Grafana Agent and execute the following:
echo 'level=info msg="INFO: This is an info level log!"' >> /tmp/flow-logs/log.log
echo 'level=warn msg="WARN: This is a warn level log!"' >> /tmp/flow-logs/log.log
echo 'level=debug msg="DEBUG: This is a debug level log!"' >> /tmp/flow-logs/log.log
Navigate to localhost:3000/explore and switch the Datasource to Loki. Try querying for {filename="/tmp/flow-logs/log.log"} and see if you can find the new label!
Now that we have added new labels, we can also filter on them. Try querying for {os!=""}. You should only see the lines you added in the previous step.
// Let's learn about relabeling and send logs to Loki!

local.file_match "tmplogs" {
    path_targets = [{"__path__" = "/tmp/flow-logs/*.log"}]
}

loki.source.file "local_files" {
    targets    = local.file_match.tmplogs.targets
    forward_to = [loki.relabel.add_static_label.receiver]
}

loki.relabel "add_static_label" {
    forward_to = [loki.write.local_loki.receiver]

    rule {
        target_label = "os"
        replacement  = constants.os
    }
}

loki.write "local_loki" {
    endpoint {
        url = "http://localhost:3100/loki/api/v1/push"
    }
}
Extract and add a Label from Logs
Note
This exercise is more challenging than the previous one. If you are having trouble, skip it and move to the next section, which will cover some of the concepts used here. You can always come back to this exercise later.
This exercise will build on the previous one, though it’s more involved.
Let’s say we want to extract the level from the logs and add it as a label. As a starting point, look at
loki.process.
This component allows you to perform processing on logs, including extracting values from log contents.
Try modifying your configuration from the previous section to extract the level from the logs and add it as a label.
If needed, you can find a solution to the previous exercise at the end of the previous section.
Note
The
stage.logfmtandstage.labelsblocks forloki.processmay be helpful.
Once you have your completed config, run Grafana Agent and execute the following:
echo 'level=info msg="INFO: This is an info level log!"' >> /tmp/flow-logs/log.log
echo 'level=warn msg="WARN: This is a warn level log!"' >> /tmp/flow-logs/log.log
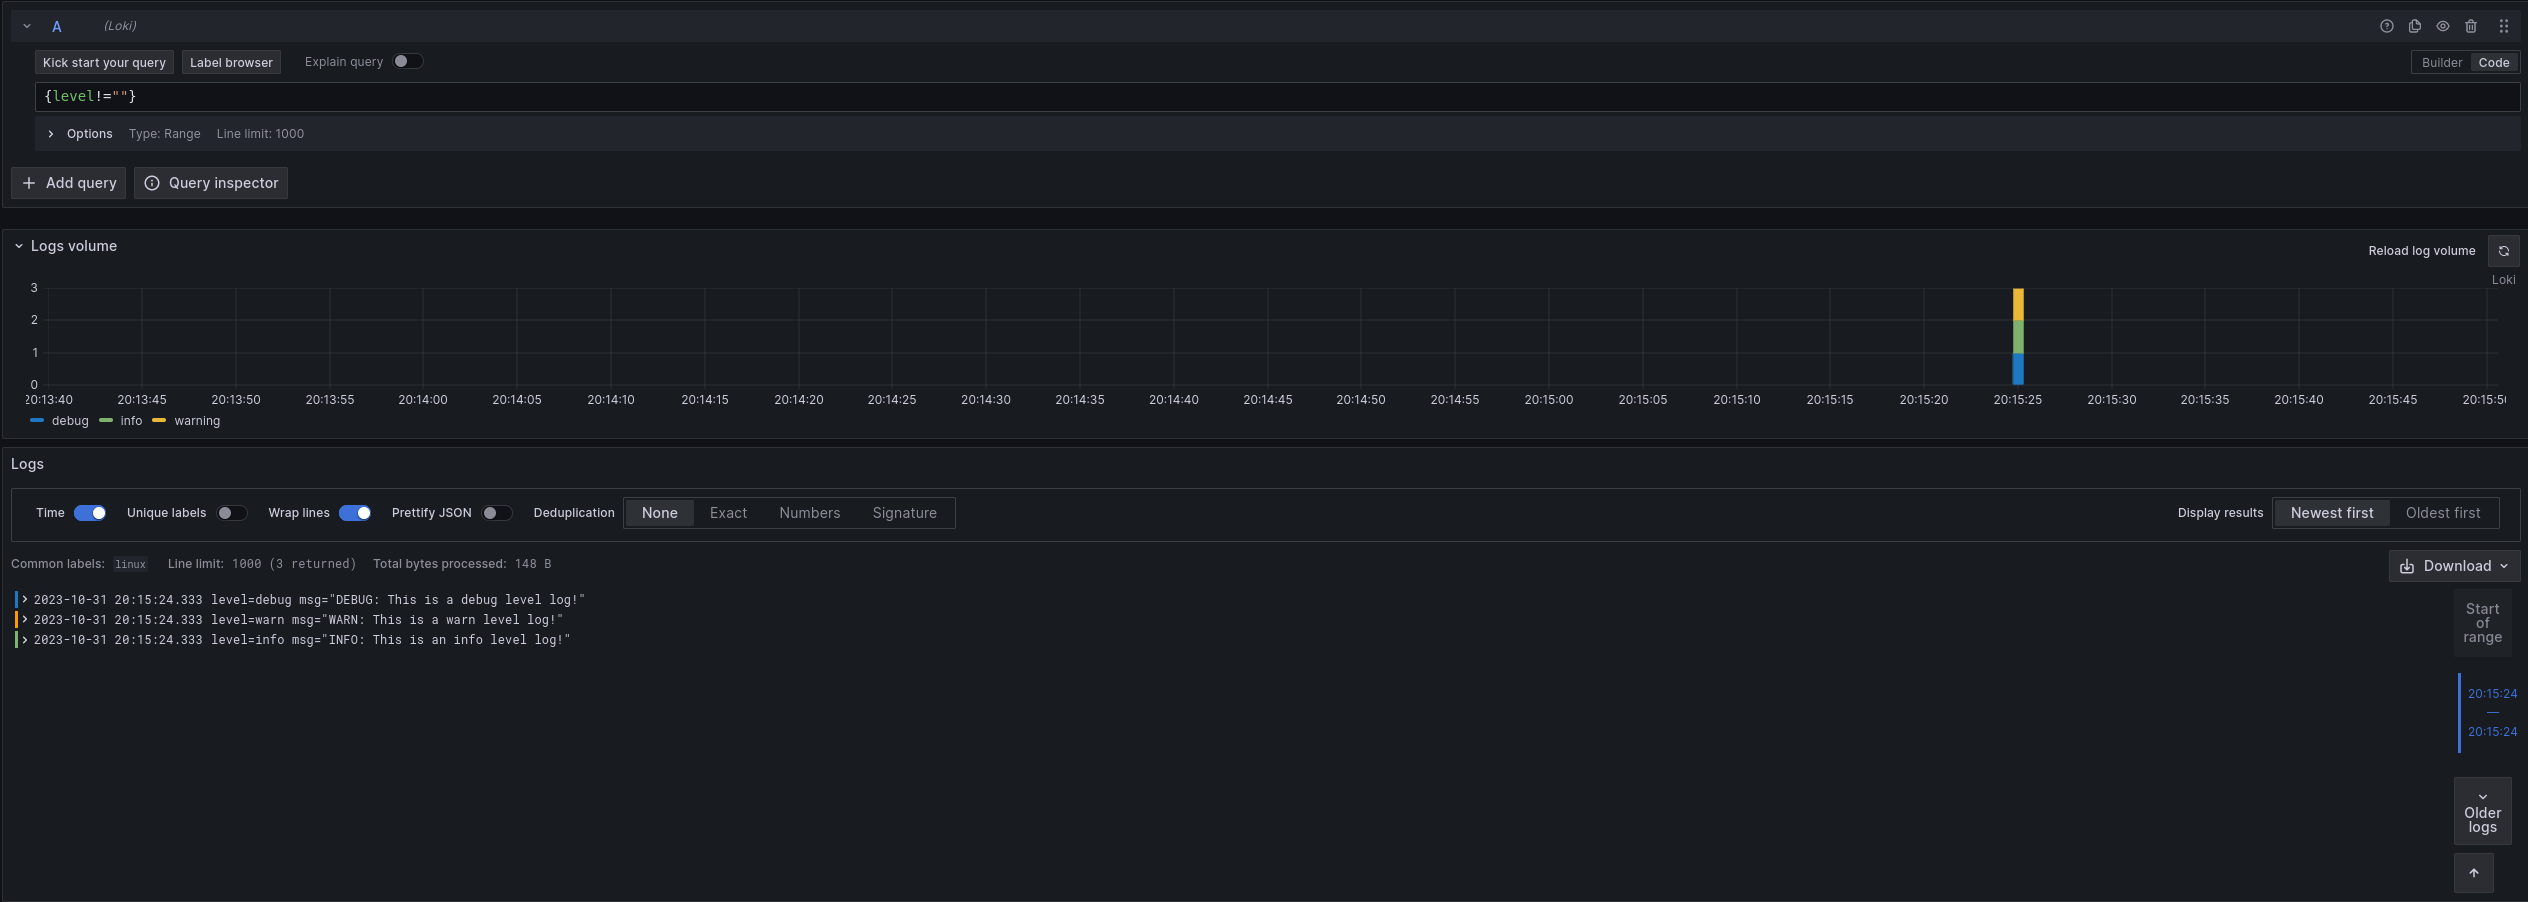
echo 'level=debug msg="DEBUG: This is a debug level log!"' >> /tmp/flow-logs/log.logNavigate to localhost:3000/explore and switch the Datasource to Loki. Try querying for {level!=""} to see the new labels in action.
// Let's learn about relabeling and send logs to Loki!

local.file_match "tmplogs" {
    path_targets = [{"__path__" = "/tmp/flow-logs/*.log"}]
}

loki.source.file "local_files" {
    targets    = local.file_match.tmplogs.targets
    forward_to = [loki.process.add_new_label.receiver]
}

loki.process "add_new_label" {
    // Extract the value of "level" from the log line and add it to the extracted map as "extracted_level"
    // You could also use "level" = "", which would extract the value of "level" and add it to the extracted map as "level"
    // but to make it explicit for this example, we will use a different name.
    //
    // The extracted map will be covered in more detail in the next section.
    stage.logfmt {
        mapping = {
            "extracted_level" = "level",
        }
    }

    // Add the value of "extracted_level" from the extracted map as a "level" label
    stage.labels {
        values = {
            "level" = "extracted_level",
        }
    }

    forward_to = [loki.relabel.add_static_label.receiver]
}

loki.relabel "add_static_label" {
    forward_to = [loki.write.local_loki.receiver]

    rule {
        target_label = "os"
        replacement  = constants.os
    }
}

loki.write "local_loki" {
    endpoint {
        url = "http://localhost:3100/loki/api/v1/push"
    }
}
Finishing up and next steps
You have learned the concepts of components, attributes, and expressions. You have also seen how to use some standard library components to collect metrics and logs. In the next tutorial, you will learn more about how to use the loki.process component to extract values from logs and use them.


