Caution
Grafana Agent has reached End-of-Life (EOL) on November 1, 2025. Agent is no longer receiving vendor support and will no longer receive security or bug fixes. Current users of Agent Static mode, Agent Flow mode, and Agent Operator should proceed with migrating to Grafana Alloy. If you have already migrated to Alloy, no further action is required. Read more about why we recommend migrating to Grafana Alloy.
Chain Prometheus components
This tutorial shows how to use multiple-inputs.river to send data to several different locations. This tutorial uses the same base as Filtering metrics.
A new concept introduced in Flow is chaining components together in a composable pipeline. This promotes the reusability of components while offering flexibility.
Prerequisites
Run the example
Run the following
curl https://raw.githubusercontent.com/grafana/agent/main/docs/sources/flow/tutorials/assets/runt.sh -O && bash ./runt.sh multiple-inputs.riverThe runt.sh script does:
- Downloads the configurations necessary for Mimir, Grafana, and Grafana Agent.
- Downloads the docker image for Grafana Agent explicitly.
- Runs the
docker-compose upcommand to bring all the services up.
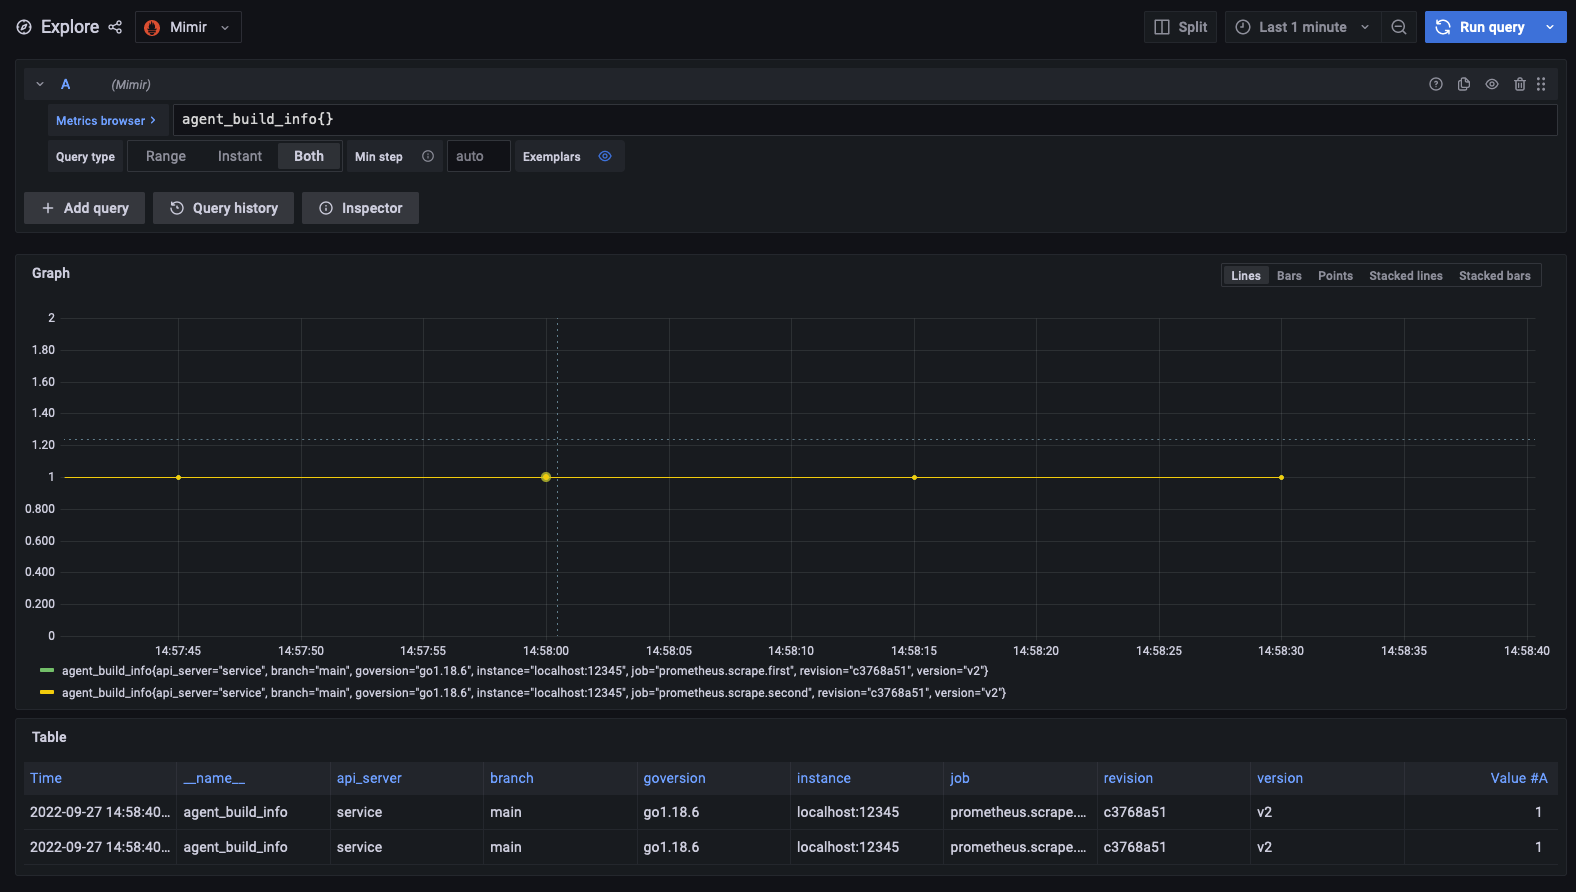
Allow Grafana Agent to run for two minutes, then navigate to Grafana to see Grafana Agent scrape metrics. The node_exporter metrics also show up now.
There are two scrapes each sending metrics to one filter. Note the job label lists the full name of the scrape component.
Multiple outputs
prometheus.scrape "agent" {
    targets    = [{"__address__" = "localhost:12345"}]
    forward_to = [prometheus.relabel.service.receiver]
}

prometheus.exporter.unix "default" {
    set_collectors = ["cpu", "diskstats"]
}

prometheus.scrape "unix" {
    targets    = prometheus.exporter.unix.default.targets
    forward_to = [prometheus.relabel.service.receiver]
}

prometheus.relabel "service" {
    rule {
        source_labels = ["__name__"]
        regex         = "(.+)"
        replacement   = "api_server"
        target_label  = "service"
    }
    forward_to = [prometheus.remote_write.prom.receiver]
}

prometheus.remote_write "prom" {
    endpoint {
        url = "http://mimir:9009/api/v1/push"
    }
}
In the Flow block, prometheus.relabel.service is being forwarded metrics from two sources prometheus.scrape.agent and prometheus.exporter.unix.default. This allows for a single relabel component to be used with any number of inputs.
Adding another relabel
In multiple-input.river add a new prometheus.relabel component that adds a version label with the value of v2 to all metrics after the prometheus.relabel.service.