Outlier detection
Outlier detection is the problem of identifying when one or more series within a group is behaving differently to the rest.
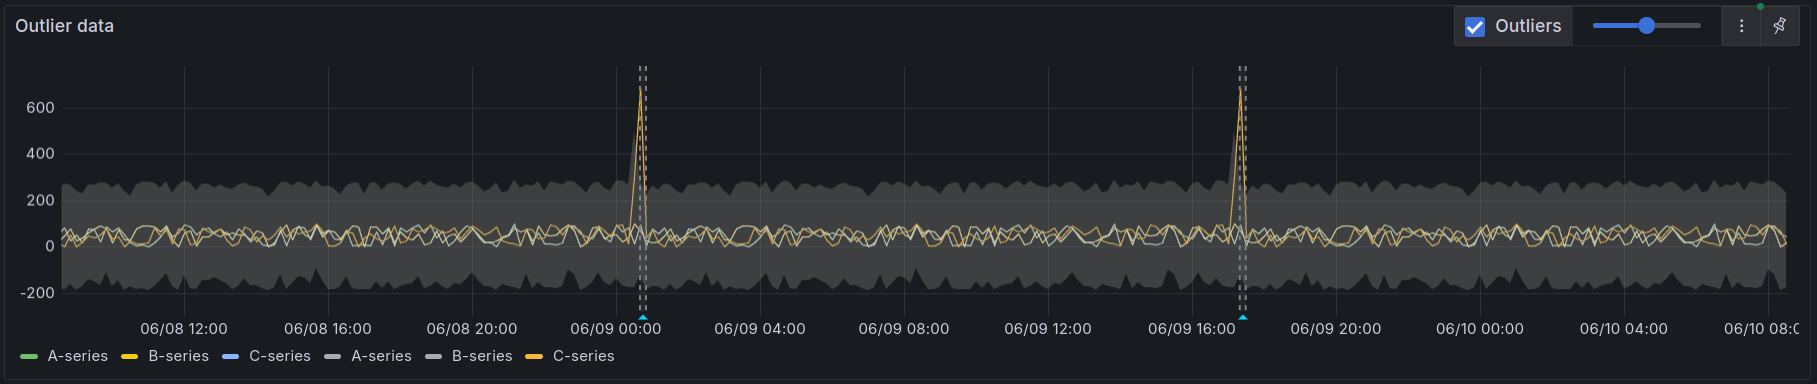
scenes-ml provides a SceneOutlierDetector component which will perform outlier detection and highlight any misbehaving series. It will also add a grey band indicating the 'cluster range' (the range of data that can be considered non-outlying), and (optionally) add annotations at time ranges where an outlier was detected.
Usage
The code example below demonstrates how to add outlier detection to a time series panel.
import { SceneOutlierDetector } from '@grafana/scenes-ml';

// Default values are shown here, all are optional.
const outlierDetector = new SceneOutlierDetector({
  sensitivity: 0.5,
  addAnnotations: false,
  pinned: false,
  onOutlierDetected: (outlier: Outlier) => {},
});
const panel = PanelBuilders.timeseries().setHeaderActions([outlierDetector]).build();
Make sure you only add outlier detection to time series panels, as it rarely makes sense for other panel types.
Pinning results
By default, baselines are recalculated on every state change, i.e. whenever the time range, query or interval changes. This isn't always desirable: for example, the user may want to zoom out and view the current forecasts in a future time range.
Enabling the pinned setting will freeze the current results, so they won't be recalculated as the time range or other settings are changed.
Technical details
scenes-ml currently uses a variant of the DBSCAN algorithm to detect outliers. Additional algorithms may be added in future.