
System Metrics - Single
Metric view designed for a single system since some graphs overlay multiple queries.
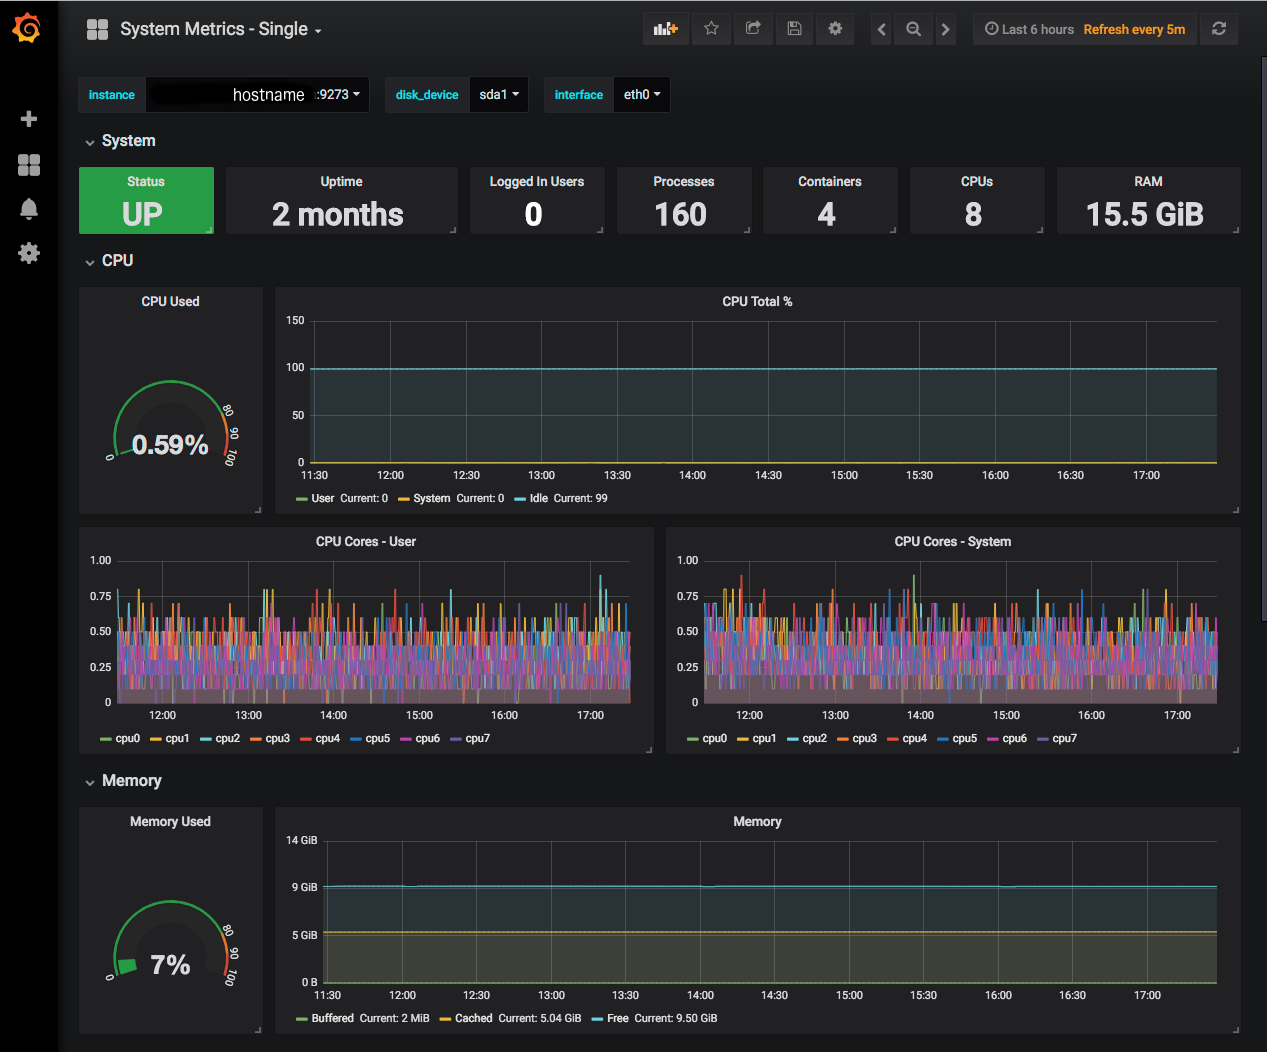
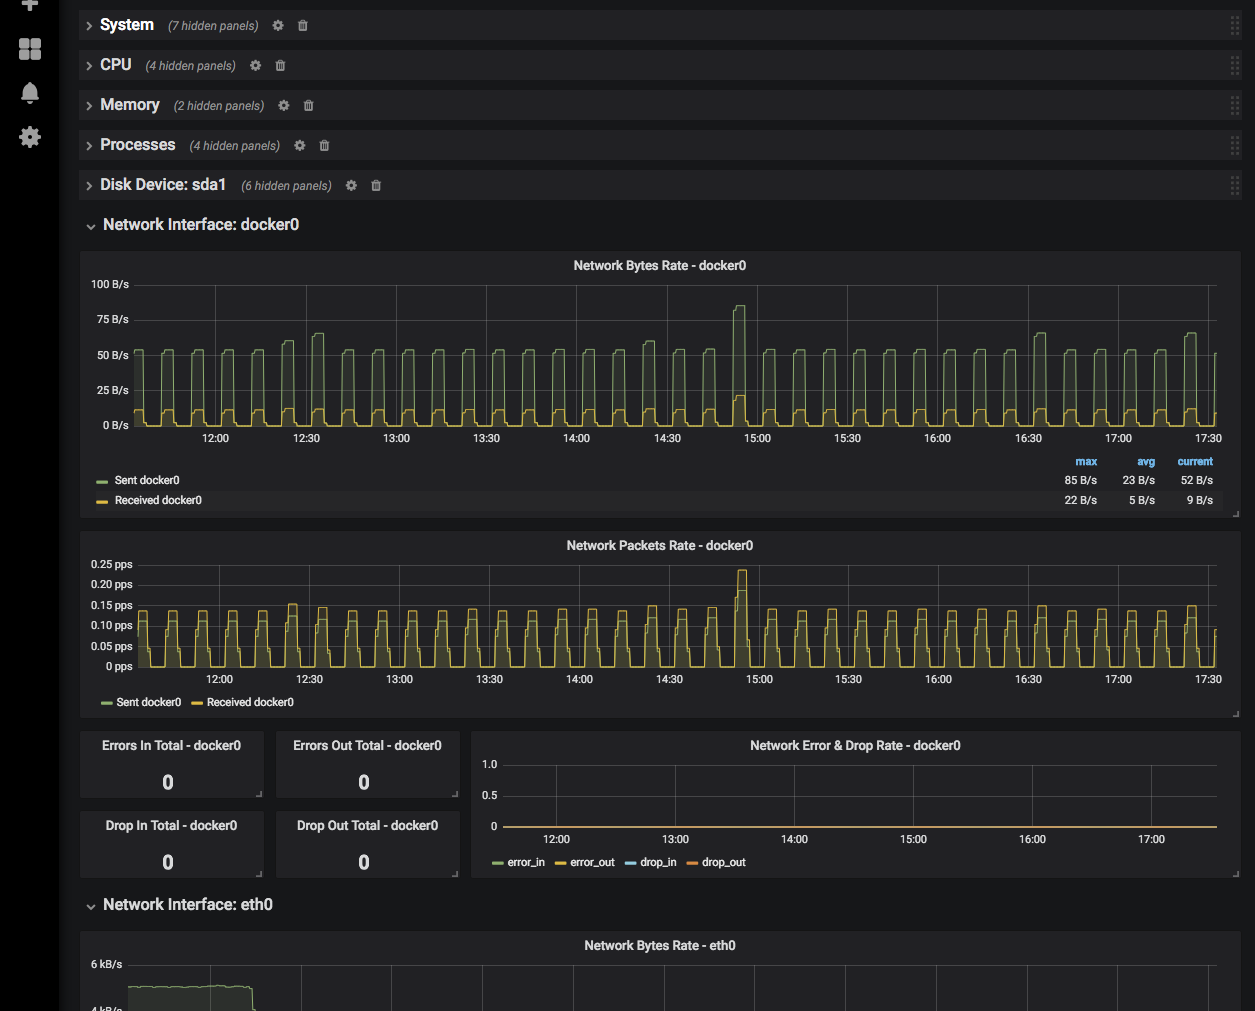
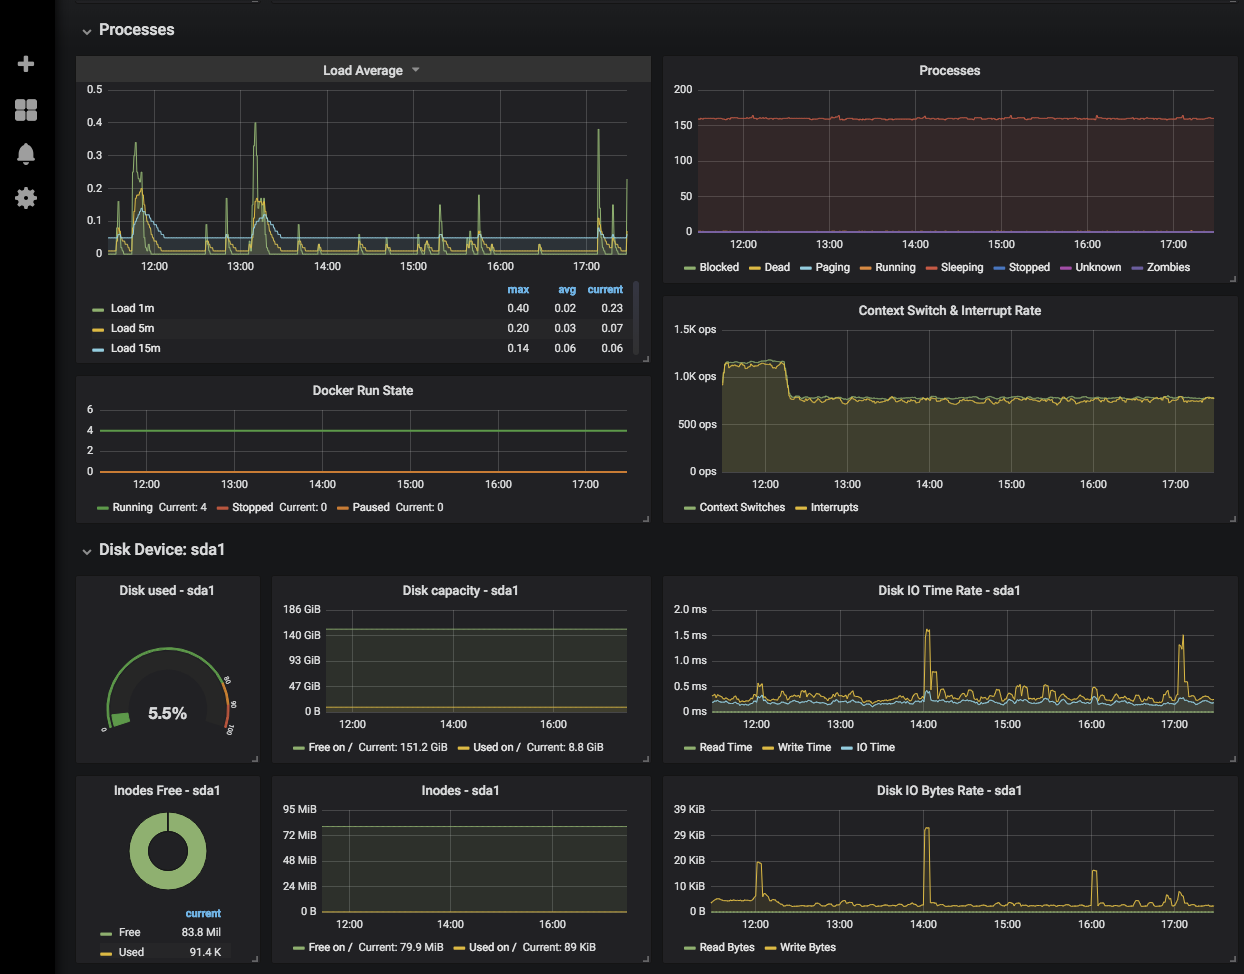
Display system metrics for a single Telegraf instance, selectable via drop-down. Metrics are grouped into collapsible rows. Provides option to filter disks and network interfaces, which are dynamic rows populated per instance.
Data source config
Collector type:
Collector plugins:
Collector config:
Revisions
Upload an updated version of an exported dashboard.json file from Grafana
| Revision | Description | Created | |
|---|---|---|---|
| Download |