A context-aware LLM agent built directly into Grafana Cloud: Introducing Grafana Assistant
With our new integrated AI agent you can write in natural language to ask observability questions, see certain data, build dashboards, and make...
Read more
Products
Grafana Cloud
Monitor, analyze, and act faster with AI-powered observability.
LGTM+ Stack
Key Capabilities
Observability Solutions
end-to-end solutions
Opinionated solutions that help you get there easier and faster
monitor infrastructure
Out-of-the-box KPIs, dashboards, and alerts for observability
visualize any data
Instantly connect all your data sources to Grafana
Grafana Cloud
Monitor, analyze, and act faster with AI-powered observability.
The actually useful free plan
10k series Prometheus metrics
50GB logs, 50GB traces, 50GB profiles
500VUk k6 testing
20+ Enterprise data source plugins
100+ pre-built solutions
Opinionated solutions that help you get there easier and faster
Instantly connect all your data sources to Grafana
Getting started with managing your metrics, logs, and traces using Grafana
Learn how to unify, correlate, and visualize data with dashboards using Grafana.
With our new integrated AI agent you can write in natural language to ask observability questions, see certain data, build dashboards, and make...
Read more
With the latest major release, Grafana introduces new tools that help bring together teams into a unified observability platform, which you can then...
Read more
Git Sync in Grafana 12 is designed to make it easy to save and manage your dashboards as code—no complex setup required.
Read more
We’re excited to share that we’ve made the initial code drop of Grafana Beyla to OpenTelemetry, under the new project name OpenTelemetry eBPF...
Read more
Building a Grafana dashboard just got easier. With Grafana 12, your dashboards will be faster to edit, easier to organize, and responsive to any...
Read more
The new observability as code features and tools in Grafana 12 allow you to version, validate, and deploy dashboards like any other code base in your...
Read more
With the first major release of Grafana k6, we’re doubling down on our commitment to make performance and reliability testing more predictable,...
Read more
Prometheus native histograms offer higher resolution and precision. They're also easier to instrument and you can use them to combine and manipulate...
Read more
With k6 browser checks in Grafana Cloud Synthetic Monitoring, you can gain an even deeper understanding of performance and availability from your end...
Read more
Explore the factors that lead to Ingress NGINX Controller metric growth and practical strategies to mitigate the issue while still retaining essential...
Read more
On April 26, an unauthorized user exploited a vulnerability with a GitHub workflow to gain unauthorized access to tokens, all of which have now been...
Read more
In this step-by-step post, learn how to use Grafana Faro, an open source web SDK, to gather real user monitoring data from web applications and...
Read more
Today we are releasing security patches for Grafana 11.6.0, 11.5.3, 11.4.3, 11.3.5, 11.2.8, and 10.4.17, which include medium and high severity...
Read more
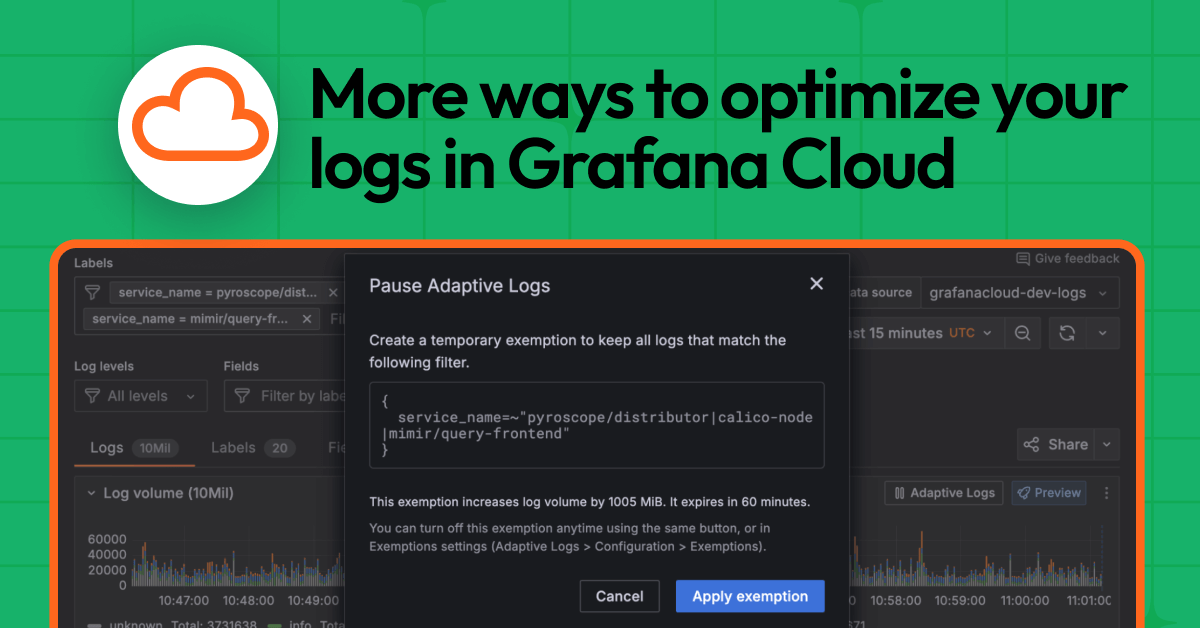
Check out these new features to help reduce toil, apply recommendations with precision, and confidently optimize your log ingestion while still...
Read more
It’s been a big month for Grafana Cloud updates, with a range of new features rolling out across Grafana Cloud k6, Kubernetes Monitoring, Frontend...
Read more