Grafana 2021: Year in review
Grafana 8.0 released, unified alerting, new panels and panel suggestions, 22 new plugins, and more ways Grafana has grown and improved in 2021.
Read more
Grafana 8.0 released, unified alerting, new panels and panel suggestions, 22 new plugins, and more ways Grafana has grown and improved in 2021.
Read more
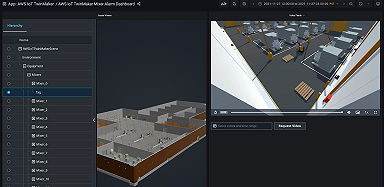
Grafana’s interoperability with a range of data sources enables AWS IoT TwinMaker users to visualize all their data, regardless of origin.
Read more
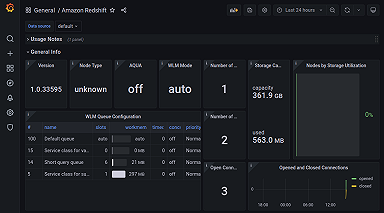
The Amazon Redshift plugin for Grafana comes with an out-of-the-box dashboard that makes monitoring all your cloud data easier.
Read more
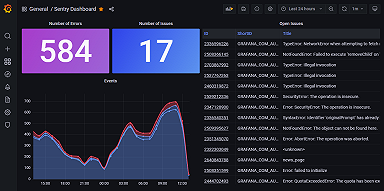
Combine issue data from Sentry with information from other observability tools in Grafana to improve application health and team velocity.
Read more
Read more
After a rigorous review of our codebase, we are confident that Grafana OSS, Grafana Cloud, and our Enterprise products are not affected.
Read more
Read more
The release of Grafana 8.3.2 and 7.5.12 include a moderate severity security fix. If you are affected, we recommend that you install newly released...
Read more
More insight into the timeline behind the recent release of Grafana 8.3.1, 8.2.7, 8.1.8, and 8.0.7 which all include a high severity security fix.
Read more
We released Grafana Agent 0.20.1 and 0.21.2 which includes security fixes. If you are affected, we recommend that you install newly released versions.
Read more
We are releasing Grafana 8.3.1, 8.2.7, 8.1.8, and 8.0.7 which include an important high severity security fix. If you are affected, we recommend that...
Read more
Read more
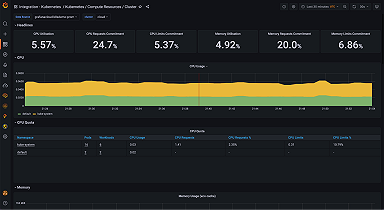
The updated Kubernetes integration for Grafana introduces new curated dashboards and built-in alerting to monitor your clusters.
Read more
With browser automation and expanded Prometheus support, k6 improves application performance and observability.
Read more
Grafana Cloud's Kubernetes integration makes it easier to troubleshoot and alert on your Kubernetes cluster.
Read more
