Grafana Cloud security update: Grafana Cloud Metrics memory corruption issue resolved
A bug introduced in a recent release of the Mimir distributor, which is part of the open source Mimir project that powers Grafana Cloud Metrics,...
Read more
A bug introduced in a recent release of the Mimir distributor, which is part of the open source Mimir project that powers Grafana Cloud Metrics,...
Read more
Grafana 12.1 includes a public preview of Grafana Advisor for automated health checks on data sources, a number of new visualization and alerting...
Read more
Grafana Labs and Tailscale have partnered on a new integration that lets you effortlessly query data sources on your tailnet directly from your...
Read more
We have a number of big Grafana Cloud updates to share this month related to Kubernetes Monitoring, Fleet Management, Adaptive Metrics, and more.
Read more
Today we are releasing security patches for Grafana 12.0.x, 11.6.x, 11.5.x, 11.4.x, and 11.3.x, which include fixes for CVE-2025-6023 and...
Read more
From pre-built dashboards to more robust security options, here’s how we’ve been enhancing the user experience when visualizing and managing Snowflake...
Read more
The latest backend update to our Kubernetes Monitoring app in Grafana Cloud features significant improvements to alert rules and recording rules that...
Read more
By tracking Core Web Vitals in Grafana Cloud Frontend Observability, you can deliver a faster, more stable, and more responsive user experience for...
Read more
Learn how to integrate Grafana Beyla with Amazon ECS to achieve deep visibility into your containerized workloads.
Read more
See why grafana/otel-lgtm has become a go-to solution for demos, development, and testing, and discover all the improvements we've made to the open...
Read more
We have released updates for the Grafana Image Renderer plugin and Synthetic Monitoring Agent to address a critical vulnerability found in a...
Read more
Learn how on-demand food and grocery delivery platform Glovo used Traces Drilldown to help find the root cause of an incident caused by cascading...
Read more
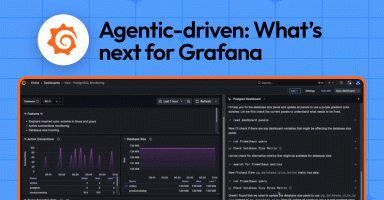
Learn how we're incorporating agentic systems into Grafana to help you get things done quicker and easier.
Read more
In order to harden our infrastructure and pipelines, we have introduced the open source tool Zizmor into our CI/CD pipelines.
Read more
This month, we’ve rolled out new Grafana Cloud features to help you troubleshoot faster in Kubernetes Monitoring, restore pipelines in Fleet...
Read more


